
May 25, 2026
Restaurant POS and Inventory Reconciliation: How to Find Variance Before Food Cost Drifts
Learn how restaurant POS and inventory reconciliation connects sales, recipes, and counts to reveal variance before food cost drifts.
A 1.5-point food cost miss on a $2M restaurant is $30,000 a year. Many operators see it only after period close. By then the ordering, prep, and portion decisions that caused it are already buried in four weeks of service.
Restaurant POS and inventory reconciliation fixes that gap. It ties item-level sales to ingredient usage, physical counts, and variance analysis so operators can see why numbers drift apart and where to act.
What restaurant POS and inventory reconciliation actually means
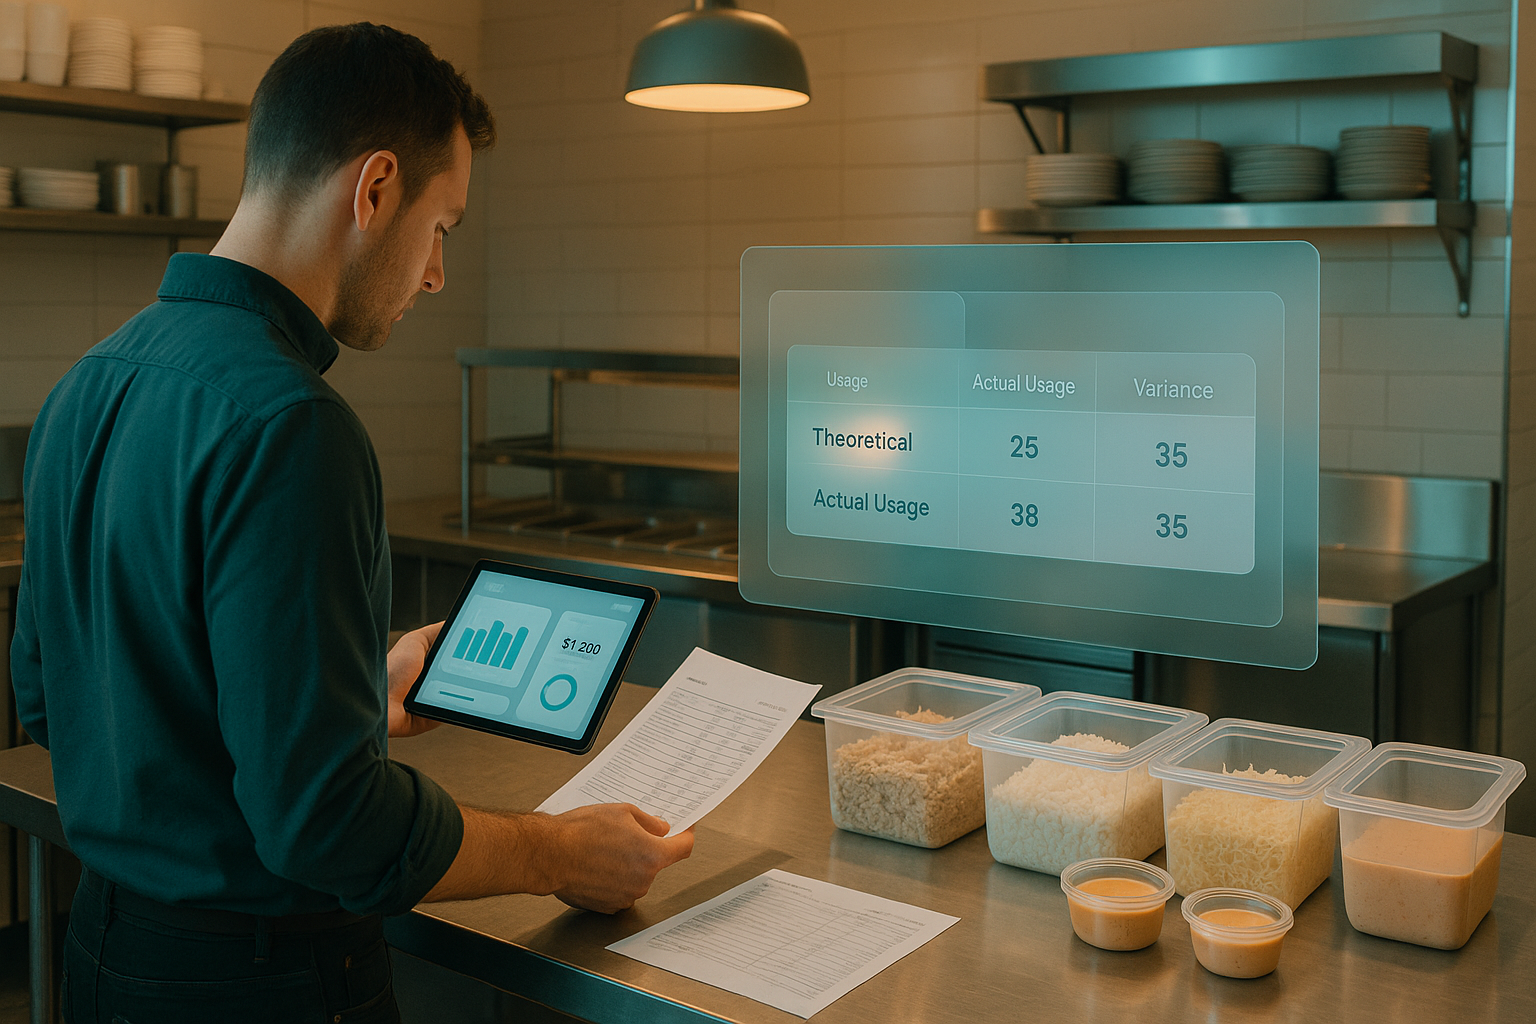
 A simple reconciliation compares what sales should have used against what inventory counts say was actually used.
Most operators hear “POS reconciliation” and think cash drawer close, card batch settlement, and deposit matching. That matters. It is a different process.
Restaurant POS and inventory reconciliation means matching three records:
- What the POS says you sold
- What those sales should have consumed, based on recipes and modifiers
- What inventory counts say you actually used
That produces two critical numbers:
- Theoretical usage: expected ingredient consumption from sales data
- Actual usage: beginning inventory + purchases + transfers in - ending inventory - transfers out
The gap between those two is variance.
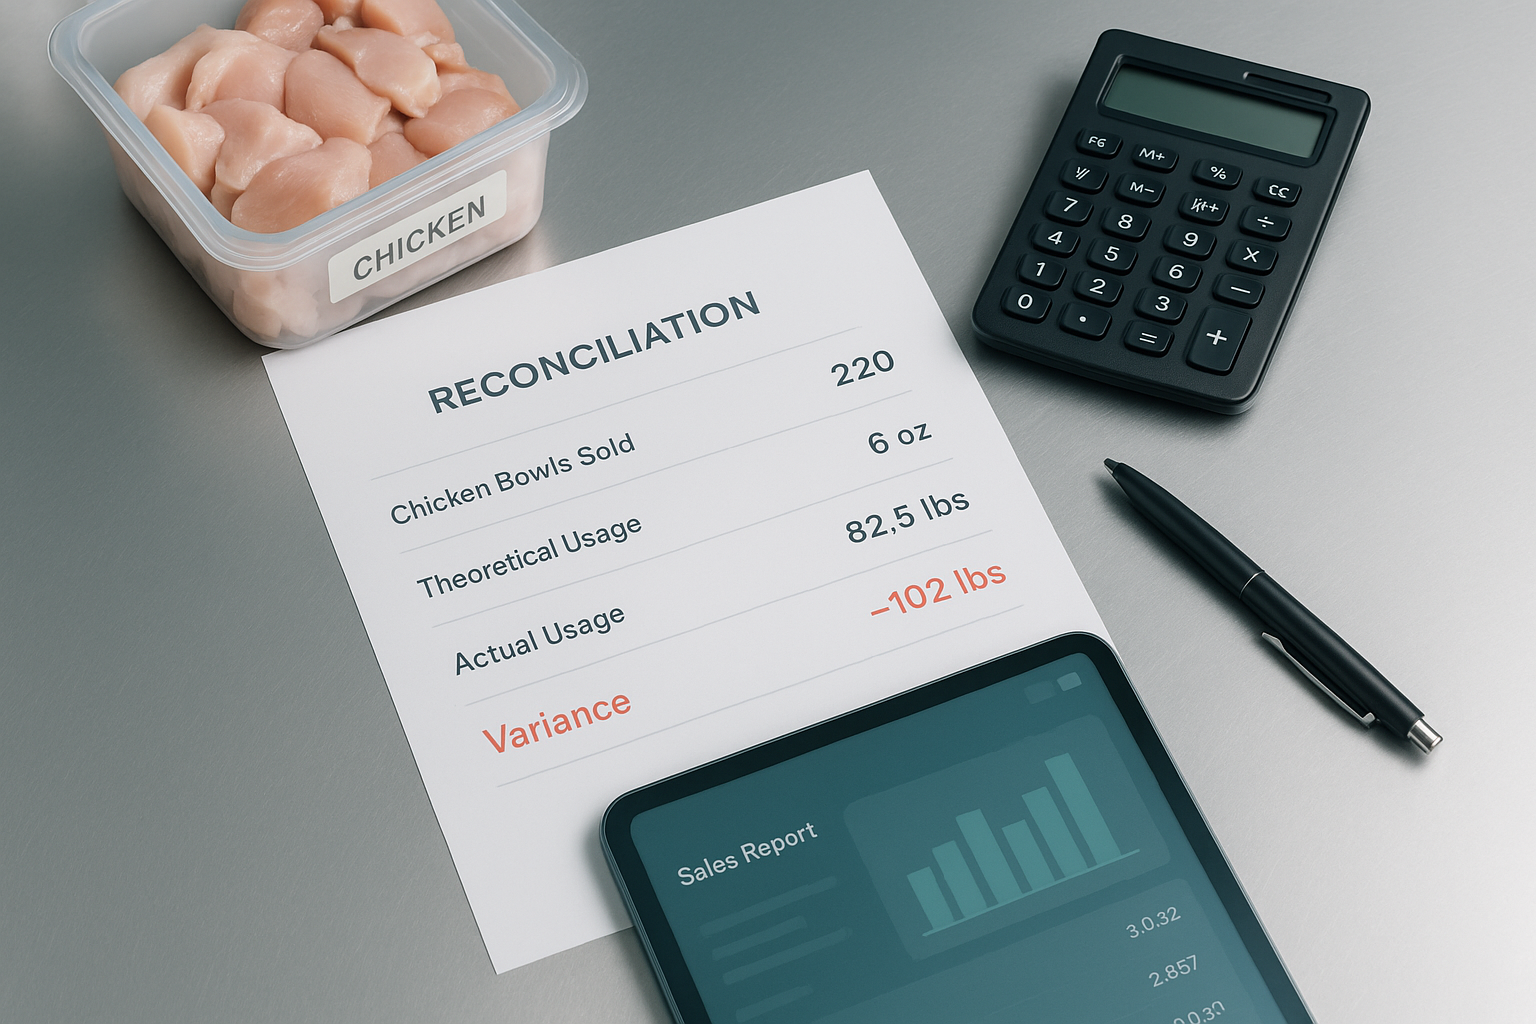
A simple restaurant pos and inventory reconciliation example looks like this:
- You sold 220 chicken bowls
- Each bowl should use 6 ounces of chicken
- Theoretical usage = 1,320 ounces, or 82.5 pounds
- Beginning chicken inventory = 120 pounds
- Purchases received = 40 pounds
- Ending count = 58 pounds
- Actual usage = 120 + 40 - 58 = 102 pounds
- Variance = 19.5 pounds over theoretical
That 19.5-pound gap is where margin disappears. Sometimes the cause is normal. More often it sits in prep waste, over-portioning, modifier mapping, unrecorded comps, or count errors.
This is also the clearest answer to what is the process of POS reconciliation in an inventory context: connect sales to recipes, convert sales into theoretical ingredient usage, compare that to physical inventory movement, then investigate material variance.
Do restaurant POS systems track inventory? Some do at a basic level. Many track menu sales well and inventory loosely. Useful reconciliation requires more than on-hand counts. It needs ingredient-level recipes, modifier logic, purchase receipts, transfer records, and count discipline in the same unit of measure.
Why sales and inventory numbers stop matching
 Modifier leakage is a common reason sales and inventory numbers stop matching.
Variance rarely comes from one source. It usually comes from five or six small failures that stack.
Recipe mapping gaps
A POS sells menu items. Inventory moves ingredients. Reconciliation breaks when the menu item is not mapped cleanly to the ingredients that drive cost.
Combo meals create problems. So do bundled family packs, catering trays, and limited-time offers. If the item sold does not reduce the correct ingredient quantities, theoretical usage is wrong before the shift ends.
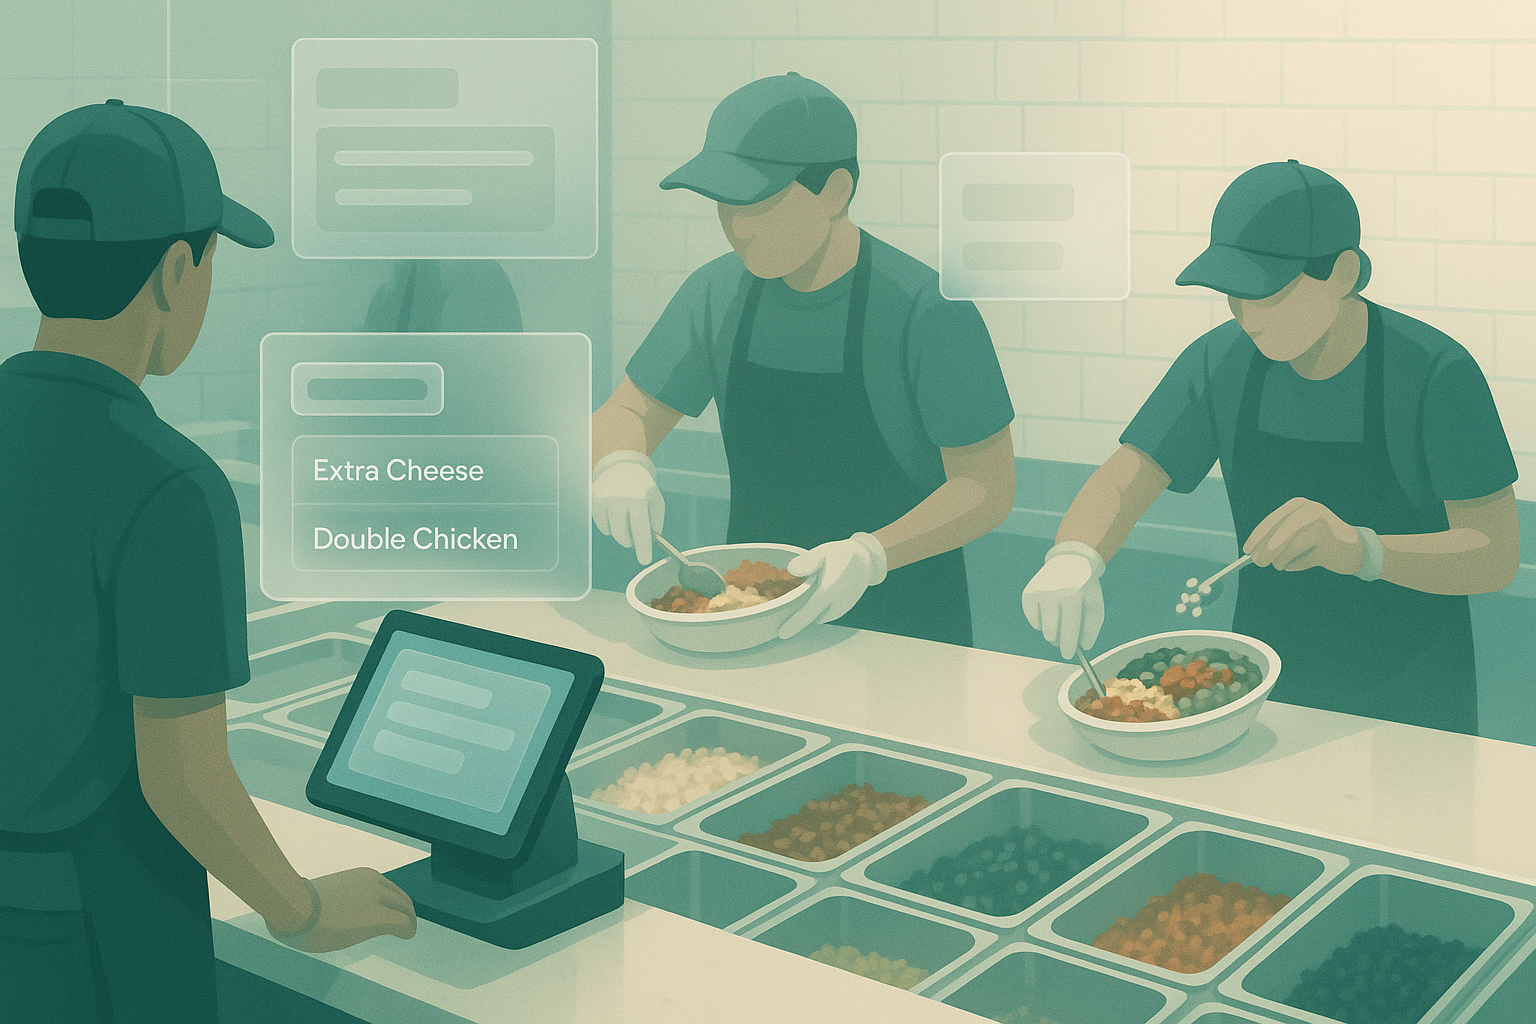
Modifier leakage
Modifiers are where fast-casual and QSR operators lose accuracy. Extra cheese. Double chicken. No rice. Side sauce. Protein swaps.
If modifiers affect actual usage but do not flow into recipe depletion, the POS understates consumption. A line with heavy add-ons can look profitable on PMIX and still blow through inventory.
A common pattern: base item recipes are maintained, but premium add-ons are tracked only for pricing. Operators then see recurring pos inventory variance restaurant issues on high-cost ingredients and blame theft before checking modifier logic.
Unrecorded waste and spill
Dropped pans, burned batches, expired prep, remake tickets, and employee meals all consume product. If waste is written on paper or not logged at all, actual usage rises while theoretical usage stays flat.
This is why category-level variance often looks worse than item-level sales trends suggest. The POS captures what guests bought. It does not automatically capture what the kitchen threw away.
Comps, voids, and off-POS production
Comps and voids need different treatment. A comp usually means the product was made and served. A void may mean it was never fired, or it may mean it was made and discarded after an error. Those states should not hit inventory the same way.
Off-POS production causes the same issue. Catering tastings, influencer meals, training meals, and shift meals often consume product outside standard sales flow. If they are not recorded, reconciliation looks worse than reality.
Portion inconsistency
A half-ounce on a sauce cup looks trivial. Across 1,200 orders a week, it adds up fast.
Take a protein that costs $3.80 per pound. An extra 0.7 ounces on 8,000 servings a year equals 350 pounds. That is $1,330 on one ingredient at one location. Add avocado, cheese, and oil, and the line moves meaningfully.
Recurring over-portioning is one of the most common causes of restaurant inventory reconciliation drift because it hides inside “good sales.”
Count timing and unit-of-measure errors
Counts taken after a partial delivery, before late-night prep, or during an open shift distort actual usage. Unit errors do the same thing.
Examples are ordinary:
- Cases received, pounds counted
- Fluid ounces in recipe, gallons in purchasing
- Trim yield ignored on produce or proteins
- Prepared batches counted the same way as raw ingredients
Many teams search for a restaurant pos and inventory reconciliation template or restaurant pos and inventory reconciliation excel sheet to solve this. Templates help structure the work. They do not fix inconsistent units or unreliable count timing.
The data model behind accurate reconciliation
Good reconciliation starts with clean operational objects. Missing one of them weakens the output.
1. Item-level sales data
You need sales by menu item, daypart, location, and modifier. Aggregate category sales are not enough. PMIX detail matters because theoretical usage depends on exactly what sold.
For fast-casual operators, this includes channels. In-store, kiosk, first-party digital, and marketplace orders can carry different modifier rates and error patterns. A 4% variance may sit almost entirely in one channel.
2. Ingredient-level recipes
Each sellable item needs a bill of materials. Each modifier needs ingredient logic. Each combo needs component logic.
Recipes should include:
- Base ingredient quantities
- Modifier adds and removes
- Batch recipes for sauces, soups, and prep items
- Yield assumptions after trim and cook loss
- Pack-to-recipe conversions
Without this layer, “inventory tracking” is mostly static count storage.
3. Purchases and transfers
Actual usage requires every inventory movement:
- Beginning count
- Purchase receipts
- Transfers in
- Transfers out
- Ending count
Multi-unit groups often have good purchasing records and weak transfer records. That creates phantom variance at both stores: one location looks short, another looks over.
4. Count cadence and count design
Monthly counts are too slow for control. Weekly counts are the practical baseline for most independents. High-value items often justify daily or every-other-day cycle counts.
A useful count design separates items into tiers:
- Tier 1: proteins, cheese, oils, alcohol, expensive produce
- Tier 2: core dry goods and staples
- Tier 3: low-cost items counted less frequently
This reduces labor without giving up visibility where dollars concentrate.
5. Standardized units
Every ingredient needs one source-of-truth unit model. Purchase unit. storage unit. recipe unit. count unit.
If chicken is bought by case, prepped by pan, sold by ounce, and counted by partial hotel pan, the conversion rules must be explicit. A credible restaurant inventory reconciliation process depends on these conversions being stable across locations and periods.
Which variances matter most for operators
Not every discrepancy deserves a meeting. Focus on the variances that move food cost or indicate process failure.
Theoretical vs actual usage on high-value ingredients
Start with expensive, fast-moving ingredients. Chicken, beef, seafood, cheese, avocado, fryer oil, and alcohol usually surface the largest dollar variances first.
A 12% variance on green onions may be annoying. A 4% variance on steak is a P&L issue.
Review variance in both percent and dollars. Percent shows control. Dollars show materiality.
Category-level variance
Group ingredients into categories operators can act on:
- Proteins
- Dairy
- Produce
- Sauces and prep
- Paper and disposables
- Beverage
- Alcohol
Category-level views help identify structural issues. Protein variance suggests portioning or theft. Sauce variance often points to batch recipe problems or unrecorded waste. Produce variance may indicate yield assumptions are off.
Recurring station-level discrepancies
Variance tied to a station is easier to fix than variance spread across the building. Grill, fry, salad, beverage, expo, and prep each have different failure modes.
Examples:
- Grill station: over-portioning proteins
- Salad station: modifier leakage on premium toppings
- Prep station: batch yields not recorded
- Beverage station: comps or spill not logged
When the same station misses three count cycles in a row, the issue is operational, not statistical.
Timing patterns across shifts and dayparts
Look for drift by lunch vs dinner, weekday vs weekend, or manager on duty. A location with clean lunch variance and weak late-night variance usually has a closing or count discipline problem.
This is where reconciliation becomes a management tool rather than an accounting task.
How reconciliation improves food cost, ordering, and accountability
The immediate benefit is cleaner food cost. The deeper benefit is tighter operations.
Theoretical usage shows what demand required. Actual usage shows what the business consumed. The gap tells managers where to intervene.
That improves prep decisions. If a sauce shows 9% weekly variance, prep pars may be too high or batch yield assumptions may be wrong. If chicken variance spikes on weekends, line build and portion tools may need review before Saturday, not after month-end.
Ordering gets tighter too. Operators who reconcile consistently buy closer to true depletion. That reduces emergency runs, excess safety stock, and spoilage in the walk-in. A one-turn improvement on refrigerated inventory can free real cash in a multi-unit system.
Month-end reporting also gets cleaner. Fewer invoice corrections. Fewer count adjustments. Less arguing over whether food cost was “real” or “timing.” Finance closes faster because operations generated reliable data during the period.
Manager accountability improves when variance has context. “Food cost was high” is vague. “Cheese variance ran $640 over theoretical, concentrated on digital orders with extra-modifier mapping gaps” is actionable.
For independents, this often replaces a stack of exports and a fragile restaurant pos and inventory reconciliation excel workbook. For multi-unit fast-casual teams, it creates one operating language across stores: same units, same recipes, same variance logic, same follow-up.
A unified system makes this work easier. Sales, recipes, receipts, counts, and variance analysis sit on the same data model. That reduces manual reconciliation, catches drift faster, and gives operators one place to review PMIX, on-hand inventory, and exception reports. Bagel is built around that operating model, with POS, inventory, and analytics connected at the record level. Teams that want earlier visibility into variance can request early access.
Reconciliation does not need to be elaborate. It needs to be consistent. Once sales, recipes, counts, and inventory movements are connected, the reasons numbers drift apart become visible enough to manage.
Run your restaurant on Bagel
Join the early access program and shape the operating system built for modern hospitality.
Get early access →