
May 17, 2026
Restaurant Menu Engineering Sales Mix: How to Use Popularity and Margin Together
Learn how restaurant menu engineering sales mix uses popularity and contribution margin together to identify Stars, Plowhorses, Puzzles, and Dogs.
A 1-point margin improvement on a $2 million restaurant is $20,000 a year. Most menus leak more than that through a handful of items that sell well, price poorly, or slow the line. Restaurant menu engineering sales mix gives operators a practical way to see which items deserve promotion, repricing, reformulation, or removal.
What sales mix means in menu engineering
 Sales mix measures how often an item sells within its category, not how profitable it is.
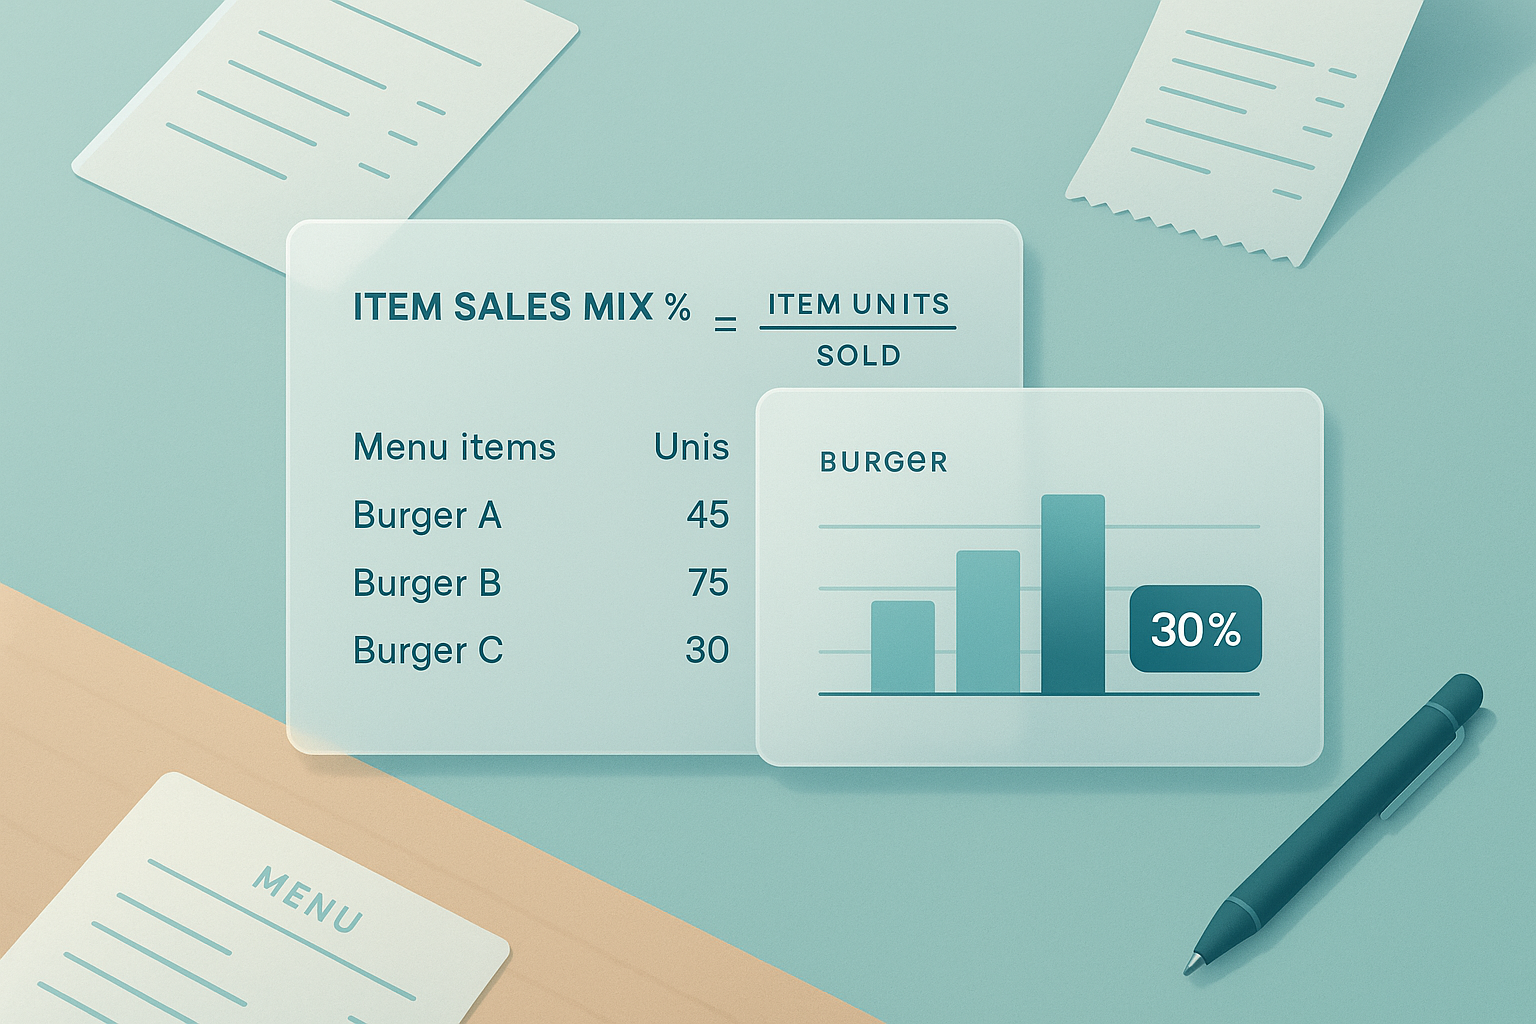
Sales mix is the share of units each item contributes within a category or menu over a period. If burgers account for 420 of 1,400 entrees sold, that item’s restaurant sales mix is 30%. The metric tracks popularity. It does not measure profitability.
Many operators stop at food cost percentage. That creates bad calls. A chicken bowl with 24% food cost can still underperform if it sells rarely or ties up prep time. A smashburger at 31% food cost can outperform if it moves volume, carries add-ons, and drives a strong contribution margin.
Menu engineering starts by separating these two ideas:
- Popularity: how often an item sells
- Profitability: how many dollars the item contributes after direct food cost
That distinction matters because guests buy menus one decision at a time. An item with modest margin but high pull can justify menu placement and operational support. A high-margin item with weak demand may need a different name, a different price point, or a smaller footprint on the board.
The basic menu mix formula is straightforward:
Item sales mix % = Item units sold / Total units sold in category
Category-level analysis matters more than whole-menu analysis for most restaurants. Comparing a side dish to an entree or a soda to a sandwich distorts the result. Guests choose among close substitutes. Burgers should be compared to burgers. Salads to salads. Kids meals to kids meals.
A useful benchmark inside classic menu engineering is expected mix. If a category has 8 items, equal popularity would imply 12.5% expected mix per item. Actual sales mix above that line suggests above-average popularity. Below it suggests weaker demand. Equal weighting is a starting point, not a law. Daypart, price bands, and menu layout all influence the outcome.
How sales mix and contribution margin work together
 Looking at margin dollars and popularity together reveals which menu items are Stars, Plowhorses, Puzzles, and Dogs.
The second input is contribution margin. In a contribution margin restaurant model, the formula is:
Contribution margin = Menu price - direct food cost
If a rice bowl sells for $14 and food cost is $4.90, contribution margin is $9.10. That dollar figure is more useful for menu engineering than food cost percentage alone because rent and labor are paid with dollars, not percentages.
Used together, sales mix and contribution margin form the core of restaurant menu analysis. One axis shows popularity. The other shows profit dollars per plate. That combination changes how you interpret menu performance.
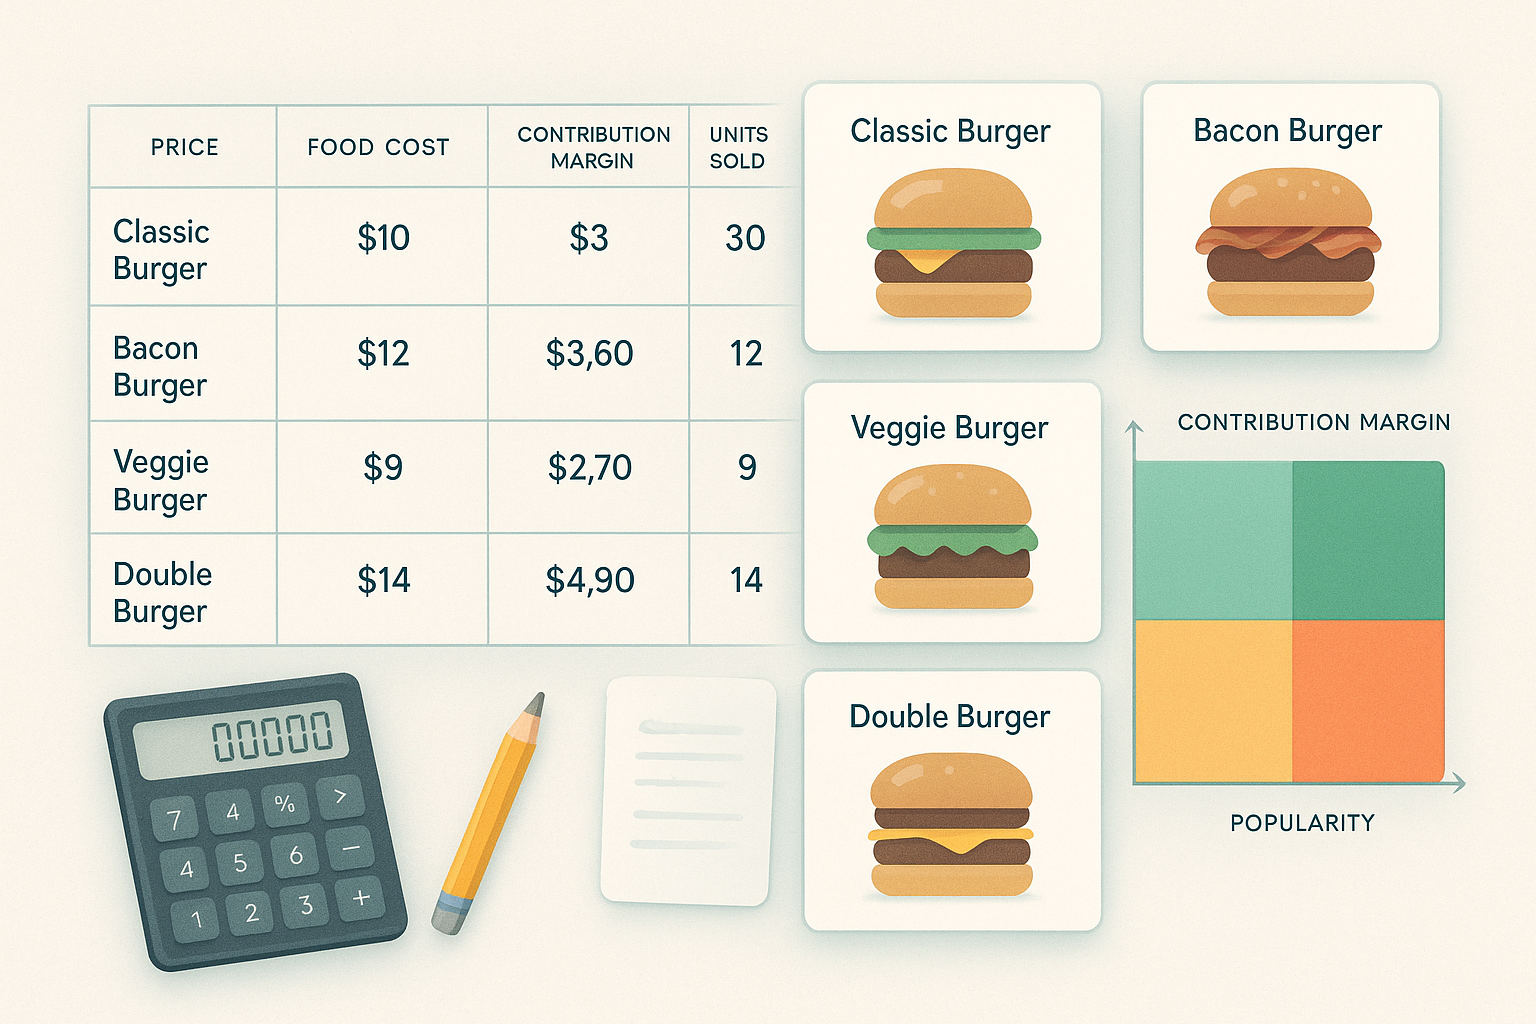
Consider this category:
| Item | Price | Food Cost | Contribution Margin | Units Sold | Sales Mix |
|---|---|---|---|---|---|
| Classic Burger | $13.00 | $4.10 | $8.90 | 520 | 32.5% |
| Bacon Burger | $15.00 | $5.80 | $9.20 | 180 | 11.3% |
| Turkey Burger | $14.00 | $4.90 | $9.10 | 110 | 6.9% |
| Veggie Burger | $14.00 | $4.20 | $9.80 | 290 | 18.1% |
| Double Burger | $17.00 | $7.60 | $9.40 | 500 | 31.3% |
A quick read based on top-line sales might push attention to the Double Burger and Classic Burger. A margin read alone might favor the Veggie Burger and Double Burger. A menu engineering view adds nuance:
- Classic Burger is highly popular with slightly lower margin dollars.
- Double Burger is highly popular with stronger margin dollars.
- Veggie Burger has healthy margin and above-average demand.
- Bacon Burger earns good dollars but lacks volume.
- Turkey Burger has acceptable margin but weak demand.
That is why restaurant menu engineering sales mix is useful. It keeps volume from hiding low dollars per plate, and it keeps high margins from hiding weak guest demand.
Data quality matters here. Contribution margin calculated from stale recipe costs will misclassify items. A burger using cheese that rose from $2.40 to $3.10 per pound can lose 30 to 50 cents in contribution margin quickly. Across 500 units a month, that is real money.
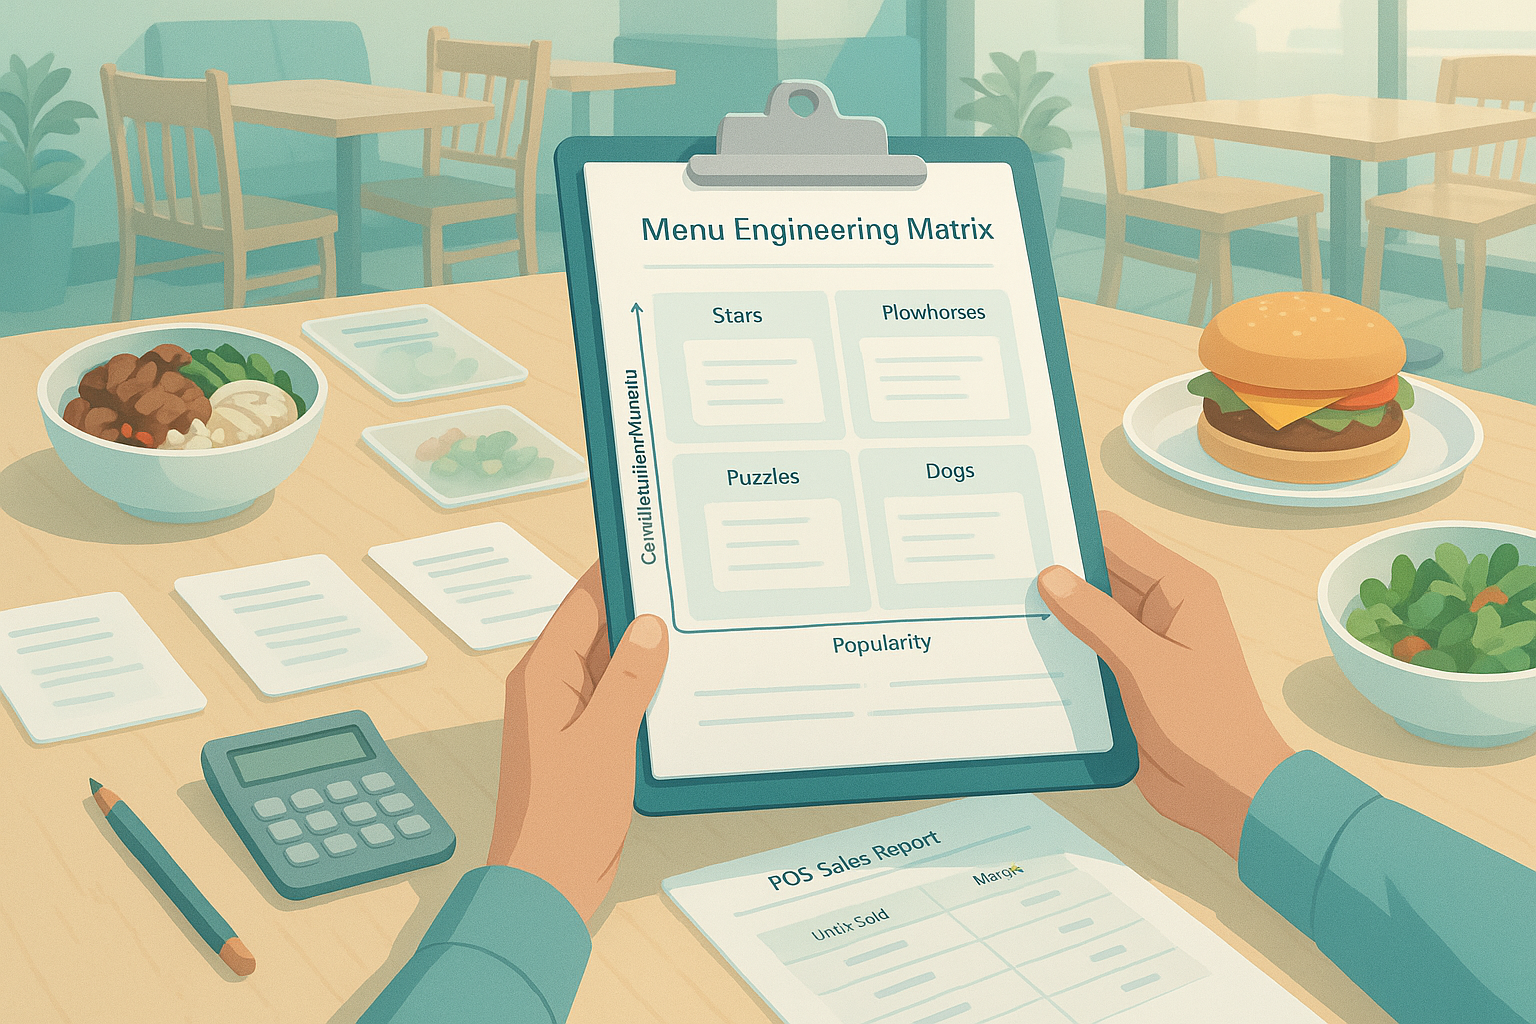
The four menu engineering categories and what they reveal
The classic menu engineering matrix groups items into four categories. Each category signals a different operating action.
Stars: high popularity, high contribution margin
Stars are the items every operator wants more of. They sell above average and contribute above average margin dollars. Keep these visible. Protect execution. Watch stockouts closely. If a Star hits the 86 list on Friday dinner, the loss is larger than a single item count suggests.
Operating implications:
- Prioritize prep coverage and pars
- Feature prominently on print, digital, and counter boards
- Train cashiers to suggest natural add-ons
- Guard recipe consistency and ticket times
Stars also justify careful price testing. Small increases can hold demand if perceived value remains intact.
Plowhorses: high popularity, low contribution margin
Plowhorses move volume but underdeliver profit. These items often anchor the guest’s value perception, so removing them can hurt traffic. The work here is optimization.
Common actions:
- Trim plate cost by 2–5%
- Shift portion size slightly
- Reprice by $0.50 to $1.00 where elasticity allows
- Improve attach rate with fries, drinks, or sauces
- Reduce assembly time if labor burden is high
A burrito that sells 900 times a month at a $6.20 contribution margin may still be essential if it drives a 38% beverage attach. Evaluating the item alone misses the total check behavior.
Puzzles: low popularity, high contribution margin
Puzzles make good money when sold but do not get selected often enough. The issue is usually positioning, naming, pricing, or awareness rather than economics.
Operators should review:
- Menu placement
- Photo usage on digital ordering
- Product naming and description clarity
- Staff recommendations
- Price gaps versus nearby alternatives
A salmon grain bowl with a $10.80 contribution margin can remain invisible if it sits below lower-priced sandwiches on the menu. Better placement can improve mix without changing the recipe.
Dogs: low popularity, low contribution margin
Dogs consume menu space and kitchen attention without paying back either. Some deserve to stay for brand reasons, dietary coverage, or a narrow but valuable customer segment. Most need a hard review.
Check three things before removal:
- Does the item serve a strategic role, such as vegetarian coverage?
- Does it share prep with stronger items, limiting inventory complexity?
- Does it sell well only in one daypart or one location?
If the answer is no across all three, de-listing is often the cleanest decision.
Why operators misread menu performance
Menu reports create false confidence when the underlying frame is wrong. Several patterns show up repeatedly.
Overreacting to revenue instead of unit economics
High sales dollars can hide thin contribution margin. A $19 entree can look strong in gross sales while contributing fewer dollars than a $15 entree with a tighter recipe. PMIX and contribution margin together are more reliable than sales dollars alone.
Ignoring attach behavior
Items rarely act alone. A value burger with mediocre standalone margin may produce a 60% fries attach and 45% fountain drink attach. Its full check contribution is stronger than item-level margin suggests. The same logic applies to desserts, modifiers, and combo paths in QSR.
Using outdated recipe costs
A restaurant menu analysis built on old invoice data is directionally wrong. Packaging inflation, protein spikes, and oil volatility can move item margins every week. Recipes need current ingredient costs and current yields. One bad yield assumption on chicken can distort an entire category.
Evaluating without daypart context
An item can be a Star at lunch and a Dog at dinner. Breakfast sandwiches, combo meals, and alcohol-free beverages often shift sharply by daypart. Looking only at monthly totals hides those patterns.
Missing location differences
Multi-unit operators see this often. A chicken wrap can outperform in suburban lunch trade and underperform in urban late-night mix. Treating the chain average as the local truth leads to poor menu changes.
Ignoring operational complexity
The matrix does not capture labor burden by itself. A high-margin item that adds three minutes to ticket time during peak may still be a problem. Prep minutes, station congestion, and error rate belong in the review. Voids, remakes, and comp checks often cluster around operationally fragile items.
How to turn sales mix analysis into better operating decisions
Menu engineering should change operations, not end as a spreadsheet. The practical value comes from connecting item mix to execution.
Adjust menu design and digital placement
Move Stars into high-visibility positions. Give Puzzles a clearer description or stronger visual treatment. Reduce clutter from Dogs. On digital ordering, sort categories and featured items based on margin-aware popularity, not habit.
Rebuild prep priorities around actual demand
Use recent sales mix to set prep pars by daypart and day of week. If one bowl now represents 24% of lunch units, prep should reflect that. Under-prepping a high-mix item creates 86 events and substitution behavior that distorts the whole menu.
Improve purchasing and inventory allocation
Sales mix informs purchasing more precisely than broad category forecasts. If the PMIX shifts from turkey to beef, trim orders follow. Better alignment reduces waste, especially on short-shelf-life produce and proteins tied to low-mix items.
Deploy labor to the right stations
A menu with growing mix in fried items needs different peak labor than one shifting toward cold assembly. Contribution margin should be read alongside production time. A high-mix, low-margin item that backs up the line can pressure both labor cost and guest satisfaction.
Use LTOs to test demand before permanent changes
Limited-time offers are useful for Puzzles and replacement candidates for Dogs. Test a new price point, a simplified build, or a revised name. Read unit sales, margin, attach rate, and ticket time before adding it permanently.
Review the matrix on a fixed cadence
Quarterly is common. Monthly is better for high-volume QSR and fast-casual operators. Weekly review can make sense for volatile categories or aggressive seasonal menus. The key is consistency. A stale menu engineering file is mostly historical trivia.
Bagel helps by tying these signals together in one operating system. POS data shows item sales mix and PMIX. Inventory keeps recipe costs current. KDS data adds prep and throughput context. Analytics connects all of it to void rate, 86 frequency, and store-level performance. That gives operators a cleaner view of which items earn their place on the menu and which ones add noise.
Conclusion
Restaurant menu engineering sales mix works best when popularity and contribution margin are read together, then tied back to prep, purchasing, and labor. The goal is a menu that sells well, contributes dollars, and holds up during peak service. If you want to see that picture in one place, Bagel’s early access is open for operators building around unified menu, inventory, and service data.
Run your restaurant on Bagel
Join the early access program and shape the operating system built for modern hospitality.
Get early access →