
May 18, 2026
Restaurant KDS Bump Time Benchmarks: How to Read the Number Without Misreading the Kitchen
Learn how to use restaurant KDS bump time benchmarks correctly by comparing like-for-like stations, dayparts, channels, and workflows.

A 40-second change in median bump time can mean very different things across concepts. In a drive-thru line, it can signal a staffing miss. On a made-to-order sauté station, it can be normal variation. Good restaurant KDS bump time benchmarks start with clean definitions, then compare like-for-like periods.
What bump time actually measures in a restaurant kitchen
 Define the start and end events clearly before treating bump time as a benchmark.
Bump time is the elapsed time between when an order or item appears on a kitchen display and when a staff member marks it complete on that screen. That sounds simple. In practice, the definition often drifts.
Some teams measure from first display to manual bump. Others include routed delay, course firing logic, or expo confirmation. A few kitchens auto-bump on handoff events. If those rules change, the benchmark breaks.
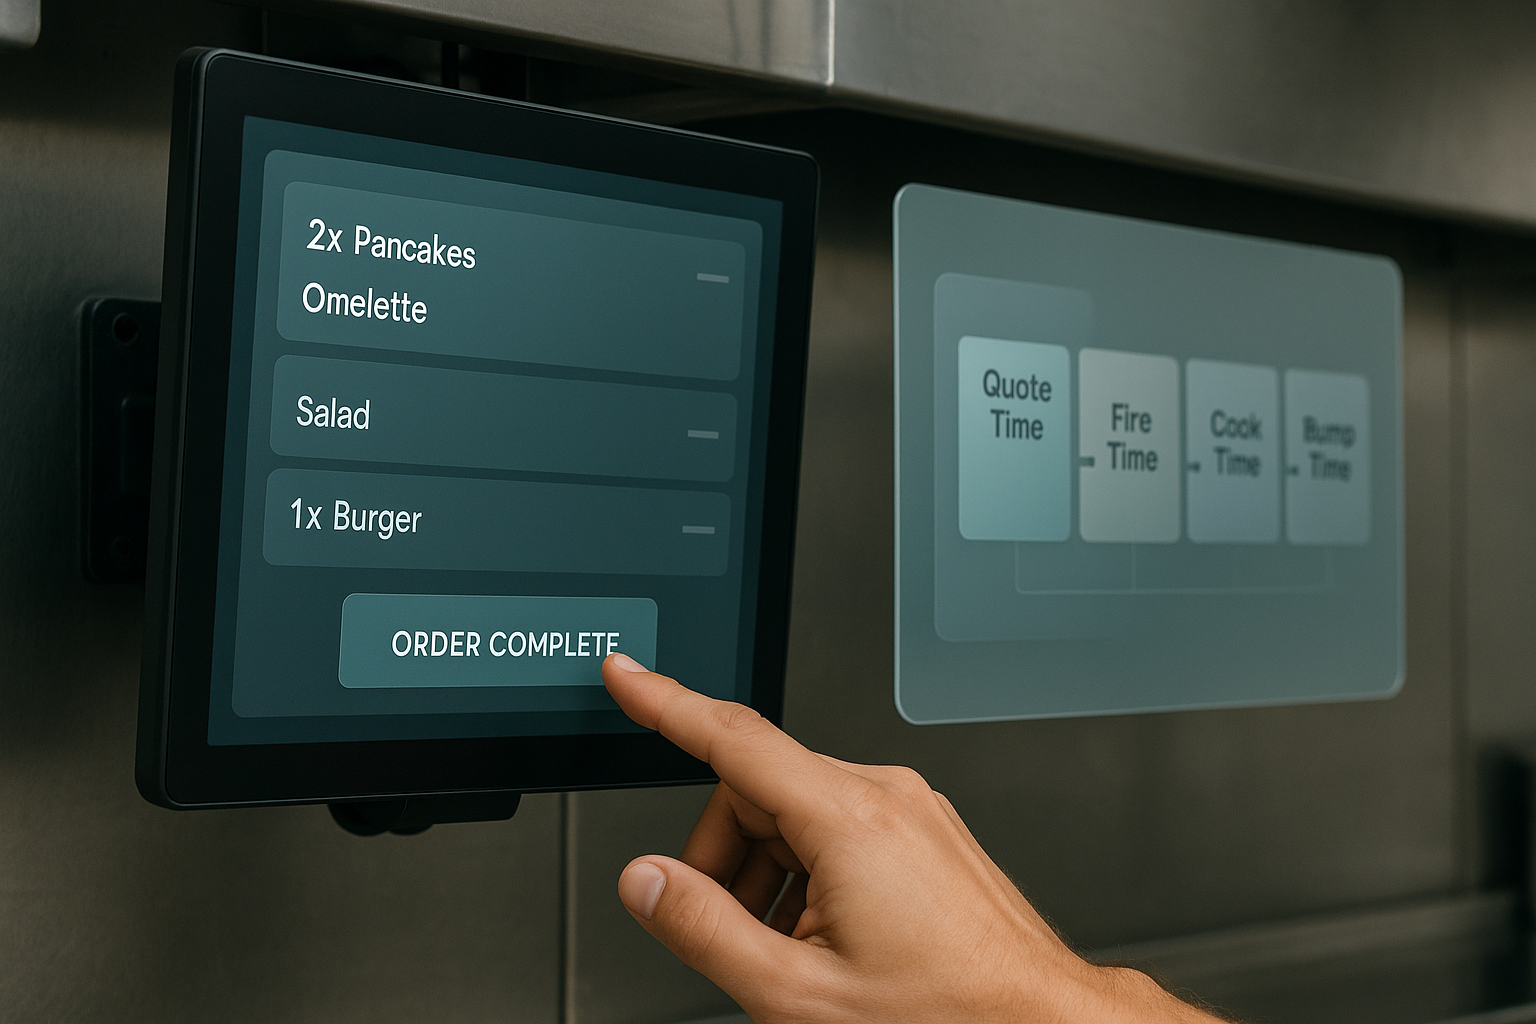
Bump time is also different from other kitchen display system metrics:
- Quote time: the promise shown to guests or channels
- Fire time: when the kitchen is told to start production
- Cook time: actual time on the grill, fryer, oven, or line
- Handoff time: when the order reaches the guest, runner, shelf, or driver
- Ticket time: often used loosely; should be defined as start-to-ready or start-to-handoff
A kitchen can have a good bump time and still miss promise times if orders sit on a shelf. Another can show poor bump time because expo waits to clear the screen in batches, even when food is leaving hot. Both cases produce misleading restaurant ticket times if the event definitions are loose.
Start with a written timing schema. Define the start event, end event, routing rules, and who owns the bump at each station. Keep those rules fixed for at least four weeks before setting benchmarks. Otherwise, trend lines reflect process edits instead of kitchen performance.
For most operators, the useful operational definition is narrow: station bump time = routed item appears on a station screen to station-complete tap. That creates a cleaner unit for station-level analysis than whole-order bump time, which mixes prep, assembly, and expo behavior into one number.
Why a single bump time benchmark can mislead operators
 The same bump time target can mean very different things at different stations.
A universal target sounds tidy. It usually creates bad calls.
A 90-second benchmark may be aggressive for a beverage station with two-touch assembly and pre-batched ingredients. The same target would be unrealistic for a grill station handling mixed doneness, modifiers, and staggered fires. Service model changes the baseline before labor even enters the picture.
Five variables drive most of the spread in kds performance metrics:
1. Service model
QSR and fast-casual kitchens usually optimize for short cycle times and stable build patterns. Full-service kitchens absorb coursing, pacing, and dine-in sequencing. A 4-minute median can be poor in one model and acceptable in another.
2. Menu mix
A basket-and-wrap lunch rush behaves differently from a dinner mix with steaks, salmon, and substitutions. Modifier density matters. So does item count per ticket. Ten tickets with one item each are not the same workload as ten tickets averaging 3.4 items.
3. Station complexity
Fry and beverage are often high-volume, shorter-cycle workflows. Grill and sauté carry longer production windows and more variation. Expo can be fast in low-modifier service and slower in multi-channel kitchens where bagging, labeling, and final checks sit at the pass.
4. Order channel
Counter, kiosk, first-party pickup, third-party delivery, and dine-in each shape sequencing. Delivery often adds packaging steps and batching behavior. Drive-thru adds hard pressure on order cadence. Counter service may produce more single-item tickets and fewer synchronized handoffs.
5. Daypart
Breakfast, lunch, afternoon snack, and dinner each have different peaks, staffing patterns, and product mixes. A kitchen with a 2.5-minute median at breakfast and 6-minute median at dinner may be healthy in both periods.
That is why prep time benchmarks restaurant teams can trust are built from internal cohorts: same location, same station, same daypart, same channel mix, same menu period. External numbers can provide rough orientation. They should not set the target on their own.
The benchmark ranges that matter by station and service context
Operators still need starting ranges. The key is to use them as directional guardrails, then tighten them with local history. For speed of service metrics restaurant teams use every shift, medians matter more than broad industry averages.
Below are practical benchmark bands for made-to-order QSR and fast-casual kitchens. These are station bump-time ranges, not promise times or guest handoff times.
Expo
Typical median range: 20–75 seconds per order finish
Watch-outs: bagging complexity, drink inclusion, delivery labeling, missing-item checks
Expo times should be short and consistent. If median expo bump time climbs above 60 seconds during high-volume pickup windows, look at packaging layout, bag staging, and whether expo is waiting on one chronic station. Long expo bumps often reflect upstream sequencing failures rather than an expo labor issue.
Fry
Typical median range: 90–210 seconds
Watch-outs: basket capacity, hold policy, side-heavy PMIX, drop timing
Fry stations often look healthy on average while hiding sharp spikes at the 90th percentile. A lunch period with 140-second median and 420-second p90 usually indicates queue compression around basket limits or late drops on bundled meals. Compare fries-only tickets against combo-heavy tickets before changing staffing.
Grill
Typical median range: 240–480 seconds
Watch-outs: doneness variance, batch strategy, modifier load, protein mix
Grill has the widest natural spread. A 5-minute median may be normal for thicker proteins and custom temperatures. It may also be slow for a narrow burger menu with standardized builds. Separate chicken, burger, and premium protein workflows. One blended benchmark hides the real constraint.
Assembly or make line
Typical median range: 45–150 seconds per item or 75–240 seconds per order
Watch-outs: ingredient reach, 86 list friction, modifier density, routing logic
Assembly is highly sensitive to line design. If item-level bumps stay flat while order-level bumps stretch, the issue may be synchronization across stations rather than line speed. Modifier-heavy digital orders often push this station higher than walk-in traffic.
Beverage
Typical median range: 20–90 seconds
Watch-outs: blended drinks, coffee equipment recovery, cup labeling, order batching
Beverage should usually be one of the most stable stations. A large spread often points to channel sequencing or equipment limits. If p50 is 35 seconds and p90 is 140, review rush batching behavior and whether beverage tickets are getting released too early.
These ranges only hold when compared within the same context. A better method is simple: build a rolling 28-day benchmark by station, daypart, and channel. Use the median as the center line. Flag variance when a shift runs 15–20% over that baseline for three comparable periods, or when p90 expands by 25% even if the median looks steady.
How to separate normal variation from true kitchen bottlenecks
Most kitchens do not have a speed problem. They have a variance problem.
Average bump time is a weak primary measure because outliers pull it around. Median tells you the middle of the shift. Percentiles show stress. Both are needed to read kitchen throughput metrics correctly.
Use median first, average second
If average bump time is 230 seconds and median is 150, a small set of delayed tickets is likely distorting the mean. That points toward exceptions, reroutes, or specific menu items. If average and median both rise together, the whole station is slowing down.
Watch the percentile spread
A healthy station usually keeps a stable distance between p50 and p90. Once that spread widens, the line is losing control under pressure. Example:
- Week 1 fry station: p50 135 sec, p90 240 sec
- Week 2 fry station: p50 142 sec, p90 390 sec
The median barely moved. The tail worsened by 150 seconds. That is usually a volume or sequencing issue, not a broad execution decline.
Compare by volume band
A station that runs 110 seconds at 20 tickets per half hour and 175 seconds at 40 tickets per half hour may be operating normally. A station that jumps from 110 to 290 under the same change has a capacity threshold problem. Build benchmarks by order volume bands, not only by clock time.
Track recurring exception patterns
Look for the same failure modes across shifts:
- Delays tied to third-party orders between 6:00 and 7:00 PM
- Grill slowdowns on tickets with more than three modifiers
- Expo stalls when beverages are on a separate screen
- Fry spikes after family bundles or side promotions
- Assembly delays linked to repeated 86 substitutions
Recurring exceptions point to system design. Random exceptions point to execution noise.
Isolate the source before changing labor
Four causes explain most bump-time deterioration:
- Staffing: too few hands or poor skill mix
- Routing: items sent to the wrong station or released in the wrong sequence
- Sequencing: stations working in isolation instead of to order completion
- Menu design: builds, bundles, or modifiers that create avoidable complexity
Labor is the most expensive fix. It should not be the first assumption.
Which companion metrics make bump time useful
Bump time alone can push kitchens toward the wrong behavior. Teams can clear screens faster by bumping early, batching carelessly, or skipping checks. That lowers the number and hurts the guest.
Pair bump time with these restaurant kds bump time benchmarks companions:
Remake rate
A faster line with remake rate rising from 1.2% to 2.4% is losing margin. At $18 average check and 300 orders a day, that extra 1.2 points can cost roughly $19,700 a year before labor.
Hold time
Food waiting 4 minutes at expo after a strong station bump time still arrives flat. Track ready-to-handoff time, especially for fries, fried proteins, and ice cream or frozen beverages.
Order accuracy
Speed gains should not increase missing items, wrong modifiers, or packaging errors. Measure comp checks, void rate, and post-production corrections alongside KDS timing.
Queue length
Queue depth explains context. A 160-second median with queue length of 3 is weak. The same median with queue length of 14 may be acceptable. Without queue data, operators overreact to normal peak load.
Channel mix
A shift that moves from 20% delivery to 45% delivery usually sees timing pressure from packaging and synchronization. Benchmarks should be segmented by channel or normalized for channel mix.
Labor deployment
Track who was on each station, start times, break coverage, and cross-trained support. Many apparent timing issues are really deployment mismatches: strongest closer on grill, weakest opener on assembly, no swing support from 12:00 to 12:30.
The goal is a balanced scorecard for restaurant ticket times. Lower bump time matters. Stable quality matters more.
How Bagel makes KDS timing benchmarks actionable
Bagel connects POS events, KDS states, order channels, and reporting in one operating model. That matters because benchmark quality depends on clean event definitions. If start and end points drift across systems or locations, timing data becomes hard to trust.
With unified order flow, teams can standardize what “fired,” “ready,” “bumped,” and “handed off” mean by station and daypart. Station-level outliers become easier to spot. Multi-location operators can compare lunch fry performance across like-for-like stores instead of blending unlike service patterns into one dashboard.
Bagel also helps operators read bump time in context. You can segment by station, channel, and daypart, then pair timing with queue depth, order accuracy, remakes, and labor deployment. That turns kds performance metrics into operating signals instead of vanity numbers.
A good benchmark is specific. It belongs to a station, a service model, a daypart, and a channel mix. If you are revisiting your restaurant KDS bump time benchmarks,
Run your restaurant on Bagel
Join the early access program and shape the operating system built for modern hospitality.
Get early access →