
June 15, 2026
Restaurant Inventory Count Frequency by Category
Set the right restaurant inventory count frequency by category with a practical framework based on value, spoilage, variance, and service risk.
Prime cost usually lands between 55% and 65% of sales. A 1-point miss on a $2 million restaurant is $20,000 a year. Count cadence affects that miss rate more than most operators expect.
The right restaurant inventory count frequency by category depends on how an item behaves in the real world: how fast it moves, how fast it spoils, how expensive it is, and how often it goes missing. A single rule like “count everything weekly” creates blind spots and unnecessary labor at the same time.
Why count frequency should vary by inventory category
 A practical inventory schedule starts by grouping items by how they behave, not just where they are stored.
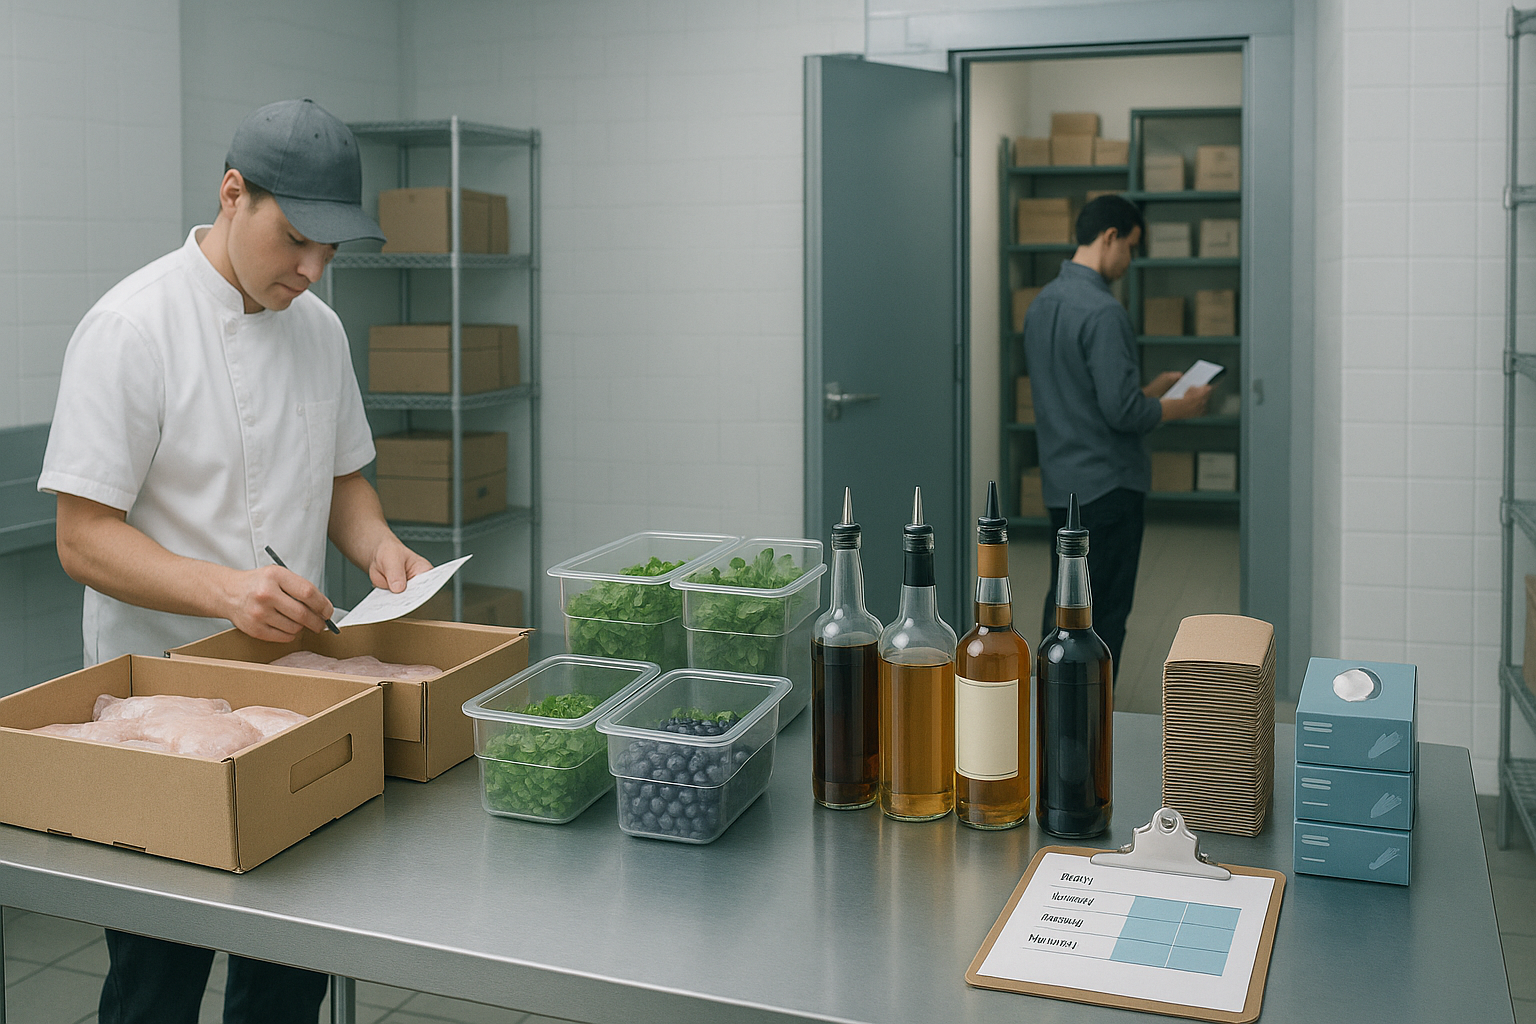
A case of chicken breasts, a bottle of tequila, a box of gloves, and a pallet of paper cups do not create the same risk. They should not sit on the same count schedule.
Proteins move fast, carry high unit cost, and create immediate food cost variance when portions drift. Produce can spoil in 48 to 72 hours and swings with prep discipline, weather, and vendor quality. Bar inventory has a high theft and comp risk, especially for top-shelf spirits, bottled beer, and wine by the glass. Paper goods often tie up cash without creating direct COGS noise until waste, over-ordering, or delivery growth changes the demand curve.
This is why the usual debate around how often should inventory be done in a restaurant misses the point. Monthly counts are too slow for volatile categories. Daily counts for every shelf burn labor with little return. Frequency should match exposure.
A useful way to think about how to categorize restaurant inventory is by operating behavior, not by storage location alone. Dry storage is a location. “High-variance dry goods” is an operating category. Frozen is a location. “Low-movement frozen proteins for seasonal specials” is the real inventory risk category.
For most restaurants, the practical categories look like this:
- High-value, high-usage, high-variance items
- Short-shelf-life perishables
- High-theft-risk beverage items
- Stable center-of-plate staples
- Slow-moving dry goods and paper supplies
- Non-consumables and low-risk support items
That structure gives you a better restaurant inventory count schedule than broad labels like food, beverage, and supplies.
The four factors that determine the right count cadence
 The best count cadence comes from four factors: value, spoilage, variance, and service risk.
A count schedule should come from four variables. Each one answers a different operational question.
1. Item value
Start with replacement cost per unit and weekly usage dollars. A case that costs $220 and turns three times a week deserves more attention than a $14 case of napkins. Value matters both at the item level and at the category level. Individual steaks may matter. Total liquor on hand may matter even more.
High-dollar categories justify tighter cycle counts because small variances become meaningful quickly. A 3% variance in a $12,000 monthly protein category is $360. The same 3% variance in condiments may be noise.
2. Spoilage window
Shelf life sets the pace. Herbs, berries, cut greens, and fresh seafood can become unusable in one or two service days. Milk, cream, and fresh dough carry a slightly longer window but still need close visibility. Frozen fries and canned tomatoes do not.
Perishability drives both waste and ordering accuracy. If the shelf life is short, waiting a week to count means the loss already happened and the order is already placed.
3. Variance risk
Variance risk combines portion drift, prep loss, transfer errors, theft, comps, void-linked misuse, and receiving issues. Bar inventory usually scores high here. Proteins scored by piece or pound also score high. Bulk flour often scores lower unless the concept does heavy scratch production and recipe yields move around.
This is where restaurant cycle counting becomes useful. Instead of counting every SKU every time, count the categories with the highest expected variance more often and the low-risk categories less often.
4. Operational criticality
Some items are cheap but service-critical. Fry oil, buns, coffee cups, delivery packaging, and kid menu staples can create sales loss or guest friction if they stock out. A missed count on an inexpensive but essential item can still hurt revenue.
Operational criticality is the tie-breaker. If an item can stop a station, delay a shift, or force menu 86s, it likely deserves a tighter cadence than its cost alone would suggest.
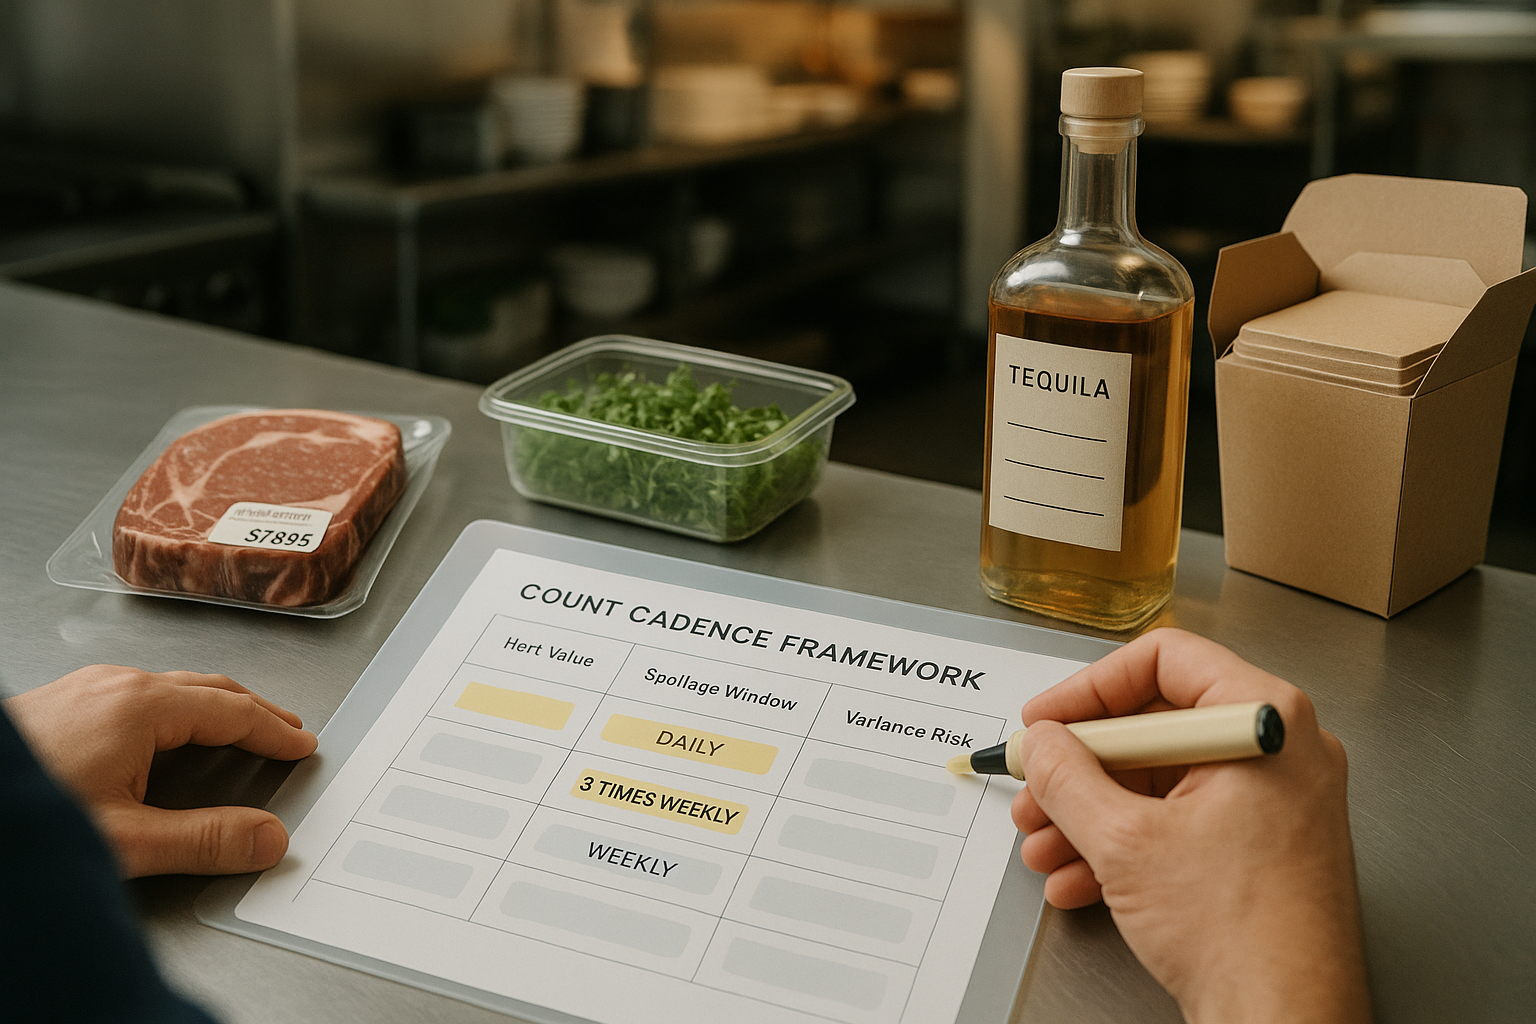
Put together, these four factors create a simple framework:
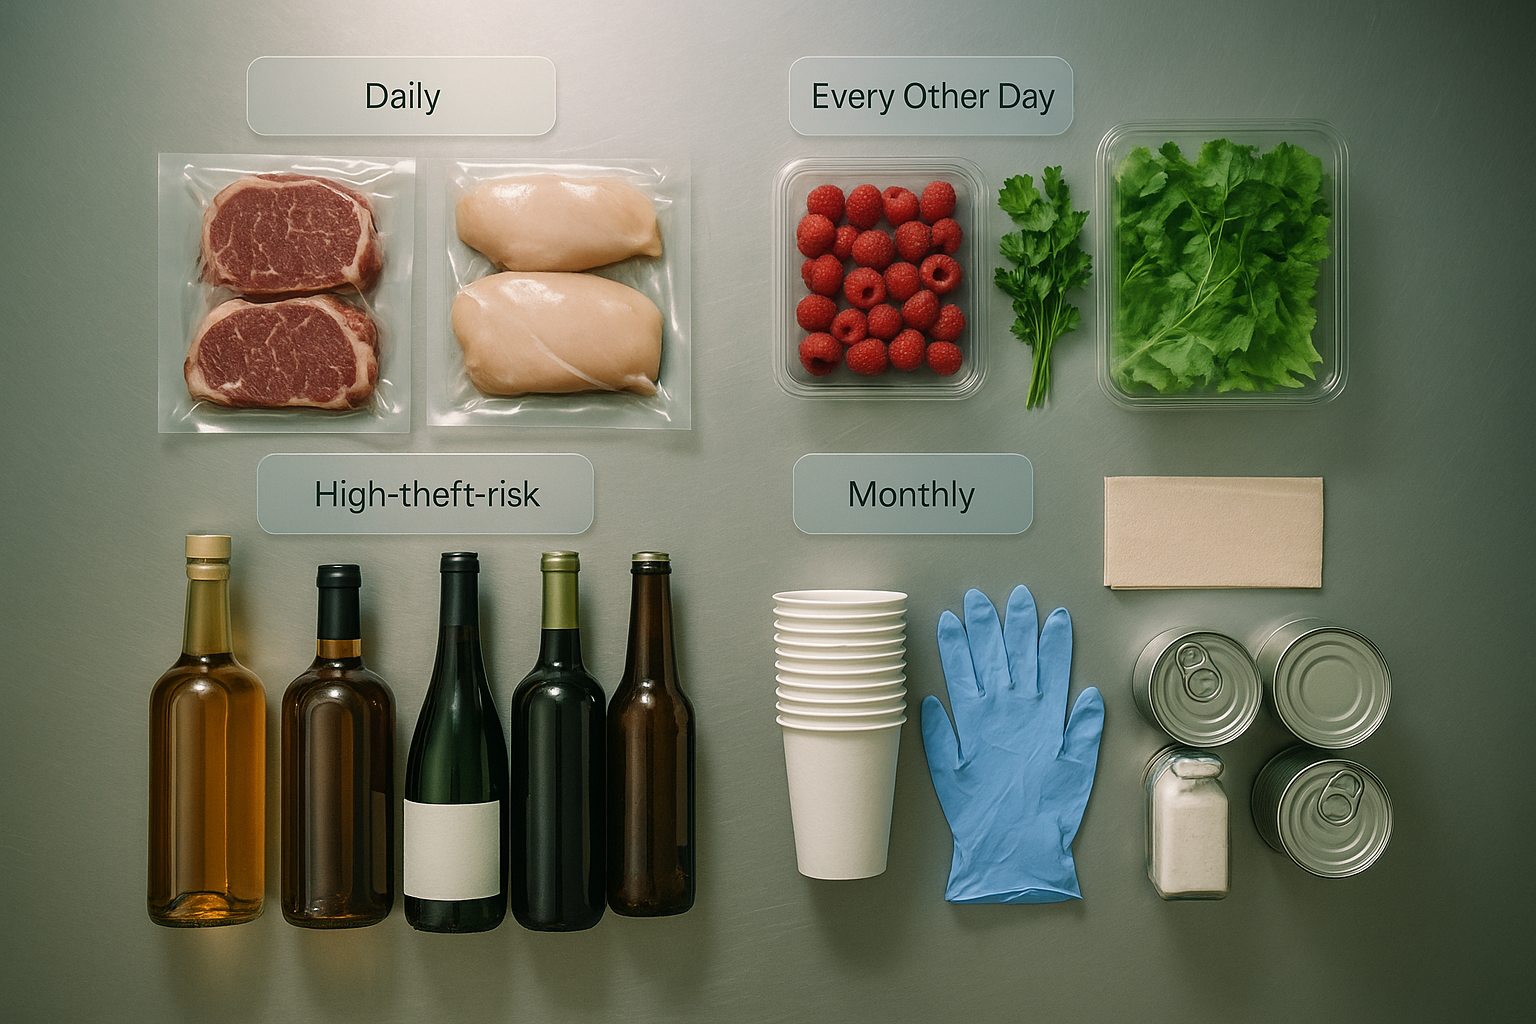
- Daily or every shift: high value, short shelf life, high variance, or service-critical
- 2–3 times per week: moderate value, moderate perishability, regular movement
- Weekly: stable items with predictable usage and low shrink
- Period-end only or monthly review: low-risk supplies, low-value backup stock, chemicals with controlled use
A category-by-category count framework for most restaurants
There is no universal template, but most operators can build a workable baseline from the categories below.
Proteins: daily to 3 times per week
Fresh beef, chicken, seafood, and premium cured meats usually need the tightest cadence. They are expensive, central to PMIX, and vulnerable to over-portioning, trimming loss, and spoilage.
A steakhouse or bowl concept with heavy protein mix should count key proteins daily. A café with limited animal protein may be fine at 2 to 3 times per week. Ground proteins and batch-prepped items deserve extra attention because yield drift hides inside prep.
Reasonable cadence:
- Daily for top 10 to 20 highest-dollar proteins
- 2–3 times weekly for the rest of the fresh protein set
- Weekly for low-movement backup frozen protein
Produce: daily to 3 times per week
Leafy greens, herbs, avocados, berries, and cut vegetables change fast. Quality decay matters almost as much as quantity. A line count that ignores trim loss will understate true consumption.
Fast-casual and salad-heavy menus should count volatile produce daily. Lower-risk produce like onions, potatoes, and whole cabbage can move to 2–3 times weekly unless volume is high.
Reasonable cadence:
- Daily for fragile, expensive, or high-throughput produce
- 2–3 times weekly for sturdy produce with moderate spoilage
- Weekly for low-risk produce in stable menus
Dairy, eggs, and refrigerated prep inputs: 2–3 times per week
Milk, cream, butter, yogurt, shredded cheese, eggs, and open sauces usually sit in the middle. They are perishable and operationally important, but variance tends to be more predictable than proteins or bar inventory.
Count more often if the menu includes heavy brunch, espresso beverages, or pizza and sandwich builds where dairy drives a large share of plate cost.
Reasonable cadence:
- 2–3 times weekly for primary refrigerated inputs
- Daily for a few high-usage items if stockouts are common
- Weekly for sealed backup inventory with stable usage
Bar inventory: daily to weekly depending on format
Liquor, wine, bottled beer, canned cocktails, and keg beer deserve their own logic. Theft risk, comp checks, over-pours, and transfer errors make beverage variance structurally different from kitchen variance.
High-volume bars should count top spirits and key packaged SKUs daily or per shift. Wine by the glass and draft require close reconciliation because depletion is hard to estimate from visual checks alone. A restaurant with a smaller beverage program may count core bar items 2–3 times weekly and full beverage weekly.
Reasonable cadence:
- Daily or per shift for top spirits and high-risk SKUs
- 2–3 times weekly for core beer and wine items
- Weekly for slower premium bottles and reserve stock
Dry storage: weekly, with selective spot counts
Rice, pasta, flour, sugar, canned goods, oils, spices, disposables, and condiments are usually more stable. Many operators overcount this category and undercount perishables. That is backwards from a labor-return standpoint.
Use weekly counts for most dry goods. Add spot checks for expensive oils, spices, nuts, or imported items if costs are elevated or theft risk rises.
Reasonable cadence:
- Weekly for standard dry goods
- 2–3 times weekly for high-cost dry ingredients in heavy use
- Monthly for truly slow-moving backup stock
Frozen goods: weekly to period-end
Frozen inventory is often stable and easy to hold, which lowers spoilage risk but can hide cash drag. A freezer full of low-turn SKUs ties up working capital and clutters ordering decisions.
Count frozen weekly in high-volume operations or where frozen items represent a large PMIX share. Smaller concepts with limited frozen assortment may use weekly spot counts plus full period-end review.
Reasonable cadence:
- Weekly for primary frozen menu items
- Monthly review for low-turn reserve inventory
- Spot counts after promotions or seasonal menu changes
Paper supplies and packaging: weekly to monthly
Cups, lids, to-go containers, bags, napkins, and gloves matter more as off-premise mix rises. These items rarely distort food cost, but they can quietly inflate supply expense and create service failures.
A delivery-heavy QSR should count core packaging weekly. A dine-in operation with low takeout mix can often review weekly at the category level and do a full count monthly.
Reasonable cadence:
- Weekly for high-volume packaging and gloves
- Biweekly or monthly for stable backup supplies
- Immediate review if off-premise sales mix shifts
Chemicals and cleaning supplies: monthly, with controls
Chemicals usually do not need frequent manual counts unless misuse, waste, or safety issues appear. Better controls here come from issue logs, locked storage, and standard dilution procedures.
Reasonable cadence:
- Monthly physical count
- Weekly visual review for critical sanitation items
How count frequency affects food cost accuracy, ordering, and cash flow
Count cadence changes the speed of detection. If you count chicken weekly, a portion problem can run for six days before anyone sees it. If you count it daily, the issue shows up after one service or one prep cycle.
That improves three things immediately.
First, food cost accuracy gets tighter. Beginning inventory, purchases, and ending inventory produce cleaner theoretical-versus-actual analysis when high-risk categories are counted often enough to catch variance near the event. PMIX analysis becomes more useful because inventory data is less stale.
Second, ordering improves. Buyers stop ordering off gut feel and start ordering off real depletion. That reduces 86 risk on fast movers and lowers over-ordering on slow movers. Perishable vs dry goods inventory counts matter here because perishables need shorter feedback loops.
Third, cash flow improves. Excess stock is cash on a shelf. If frozen backstock, paper goods, or low-turn dry goods are only reviewed at period end, overbuying can sit unnoticed for weeks. Weekly category-level visibility helps cut dead inventory before it piles up.
A disciplined restaurant inventory count schedule also reduces labor waste. Teams stop doing full-building counts that produce low-value data. Instead, they spend 20 minutes on the SKUs that drive 80% of the variance.
When to adjust your inventory schedule
Count cadence should change when the business changes. A fixed schedule becomes inaccurate as soon as the operating model shifts.
Increase frequency when you see these signals:
- New menu launches with unfamiliar yields or ingredients
- Seasonal volume spikes
- Persistent variance above 2% to 3% in a category
- New location openings
- Kitchen manager or bar manager turnover
- Expansion into catering, third-party delivery, or meal periods with different packaging needs
- More comp checks, void rate movement, or unexplained waste
- Vendor substitutions or unstable pricing in key categories
Decrease frequency when a category becomes boring in the best way: stable usage, low variance, predictable ordering, and low stockout risk over multiple periods.
For multi-unit operators, avoid forcing every store into the same schedule. A suburban lunch-heavy unit, an urban late-night store, and a catering commissary do not carry the same risk profile even with the same recipes.
Bagel supports this process by giving operators cleaner item structure, category-level organization, faster count workflows, and clearer variance reporting. That makes it easier to run daily counts on proteins, weekly counts on dry storage, and exception-based reviews where the numbers justify attention. If you are building a repeatable inventory routine across one store or many, early access is open for teams that want tighter operating visibility without adding more counting labor.
Run your restaurant on Bagel
Join the early access program and shape the operating system built for modern hospitality.
Get early access →