
May 15, 2026
Restaurant Food Cost Variance Explained
Restaurant food cost variance explained with clear formulas, examples, and practical guidance on actual vs. theoretical food cost and profit impact.
A 2-point food cost swing on a $2.5M restaurant is $50,000 a year. Most operators see the damage after close, after payroll is set, and after margin has already leaked out of prep, line execution, and purchasing.
This is restaurant food cost variance explained in operating terms: the gap between what food should have cost based on recipes and sales, and what it actually cost based on purchasing and inventory movement.
What restaurant food cost variance actually measures
Food cost percentage tells you how much of sales went to food. It does not tell you why. Variance does.
Food cost variance measures the difference between theoretical food cost and actual food cost. Theoretical is the expected cost based on item-level recipes, standard portions, and PMIX. Actual is the cost that hit the building based on beginning inventory, purchases, and ending inventory.
That gap matters because two restaurants can both post a 31% actual food cost and be in very different shape.
One unit may run a 30% theoretical and land at 31% actual. That is a 1-point variance. Another may run a 26% theoretical and land at 31% actual. That is a 5-point variance. Same headline food cost. Very different control environment.
For operators asking what is food cost variance, the plain-language answer is simple:
Food cost variance is the difference between what your menu should have consumed and what your business actually consumed.
Many teams call this AvT, short for actual vs. theoretical. If you have searched avt meaning restaurant, that is the category. It is a cost-control method built around comparing expected usage to real usage.
Variance is more useful than food cost percentage alone because it isolates execution.
It shows whether margin loss came from:
- over-portioning
- waste
- theft
- bad yields
- invoice increases
- comps and voids that never mapped correctly
- recipe standards that no longer match the line
Food cost percentage is a result. Variance is a control signal.
Actual vs. theoretical food cost: where the numbers come from
 Actual food cost comes from inventory movement and purchases, not recipe expectations.
 Theoretical food cost depends on accurate recipes, yields, unit conversions, and sales mix.
The comparison only works if the inputs are clean. Most bad variance reporting starts with bad source data.
Actual food cost
Actual food cost usually comes from this formula:
Beginning Inventory + Purchases - Ending Inventory = Cost of Goods Sold
Then:
Actual Food Cost Percentage = Actual Food Cost ÷ Food Sales
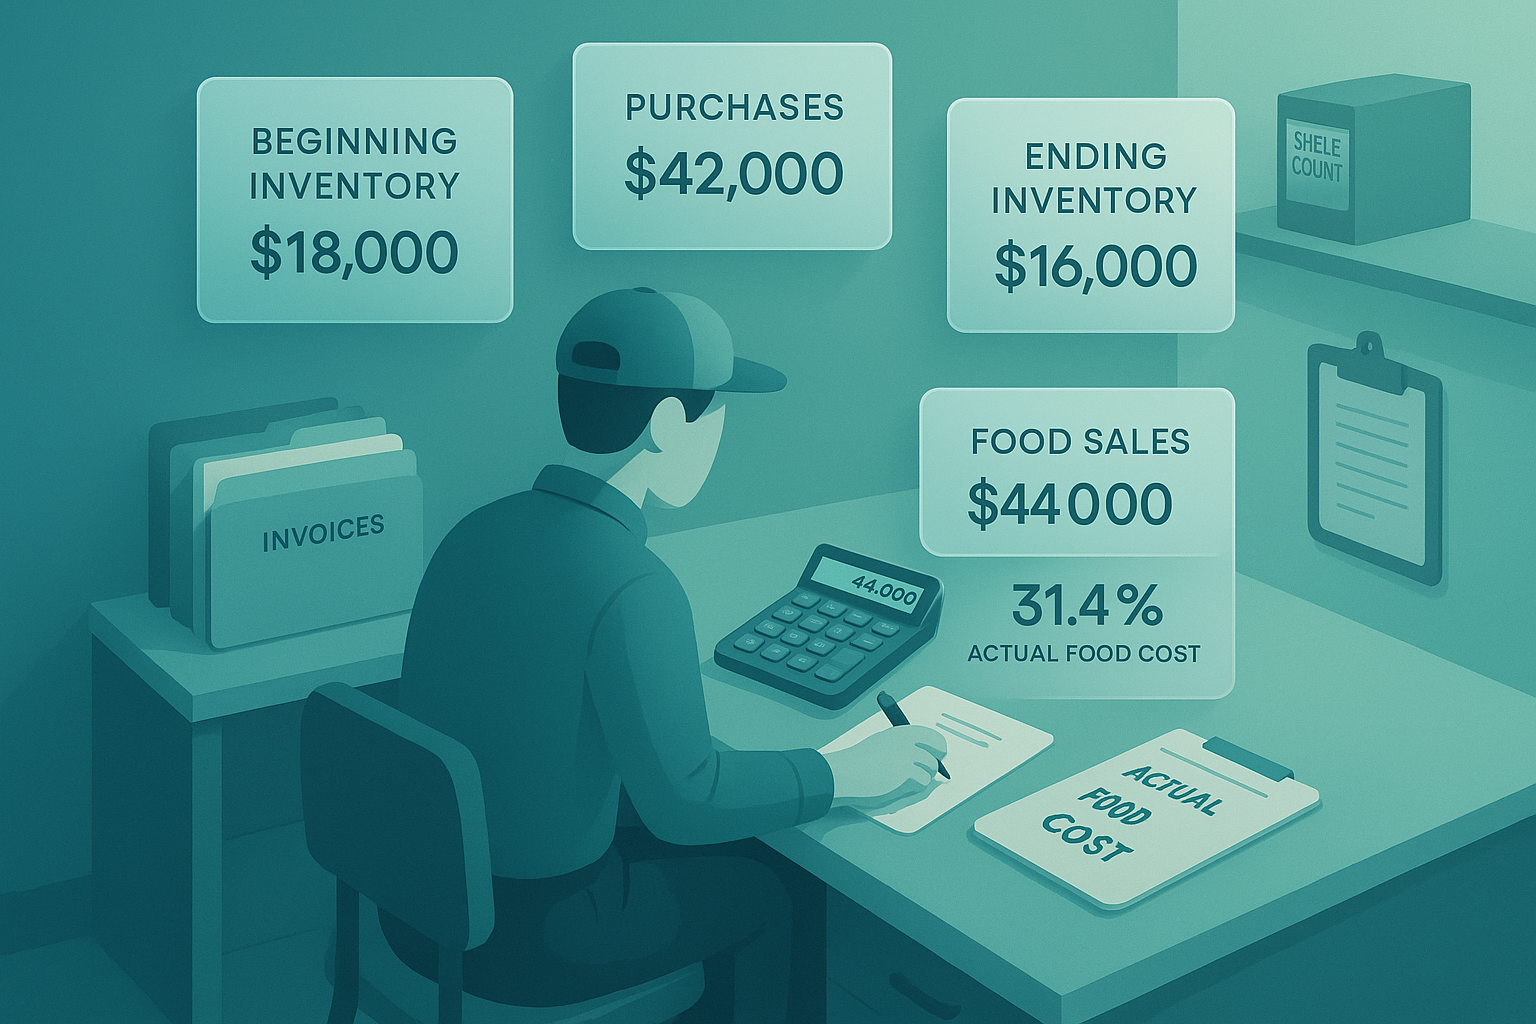
Example:
- Beginning inventory: $18,000
- Purchases: $42,000
- Ending inventory: $16,000
Actual food cost in dollars:
- $18,000 + $42,000 - $16,000 = $44,000
If food sales were $140,000:
- $44,000 ÷ $140,000 = 31.4% actual food cost percentage
That number is useful. It still does not explain whether 31.4% was expected.
Theoretical food cost
Theoretical food cost is built from recipe standards and sales mix.
Each menu item needs:
- a current recipe
- standard ingredient quantities
- correct pack sizes and unit conversions
- expected prep yields
- a mapped sellable item in the POS
- the latest ingredient cost
Then the system multiplies recipe cost by units sold.
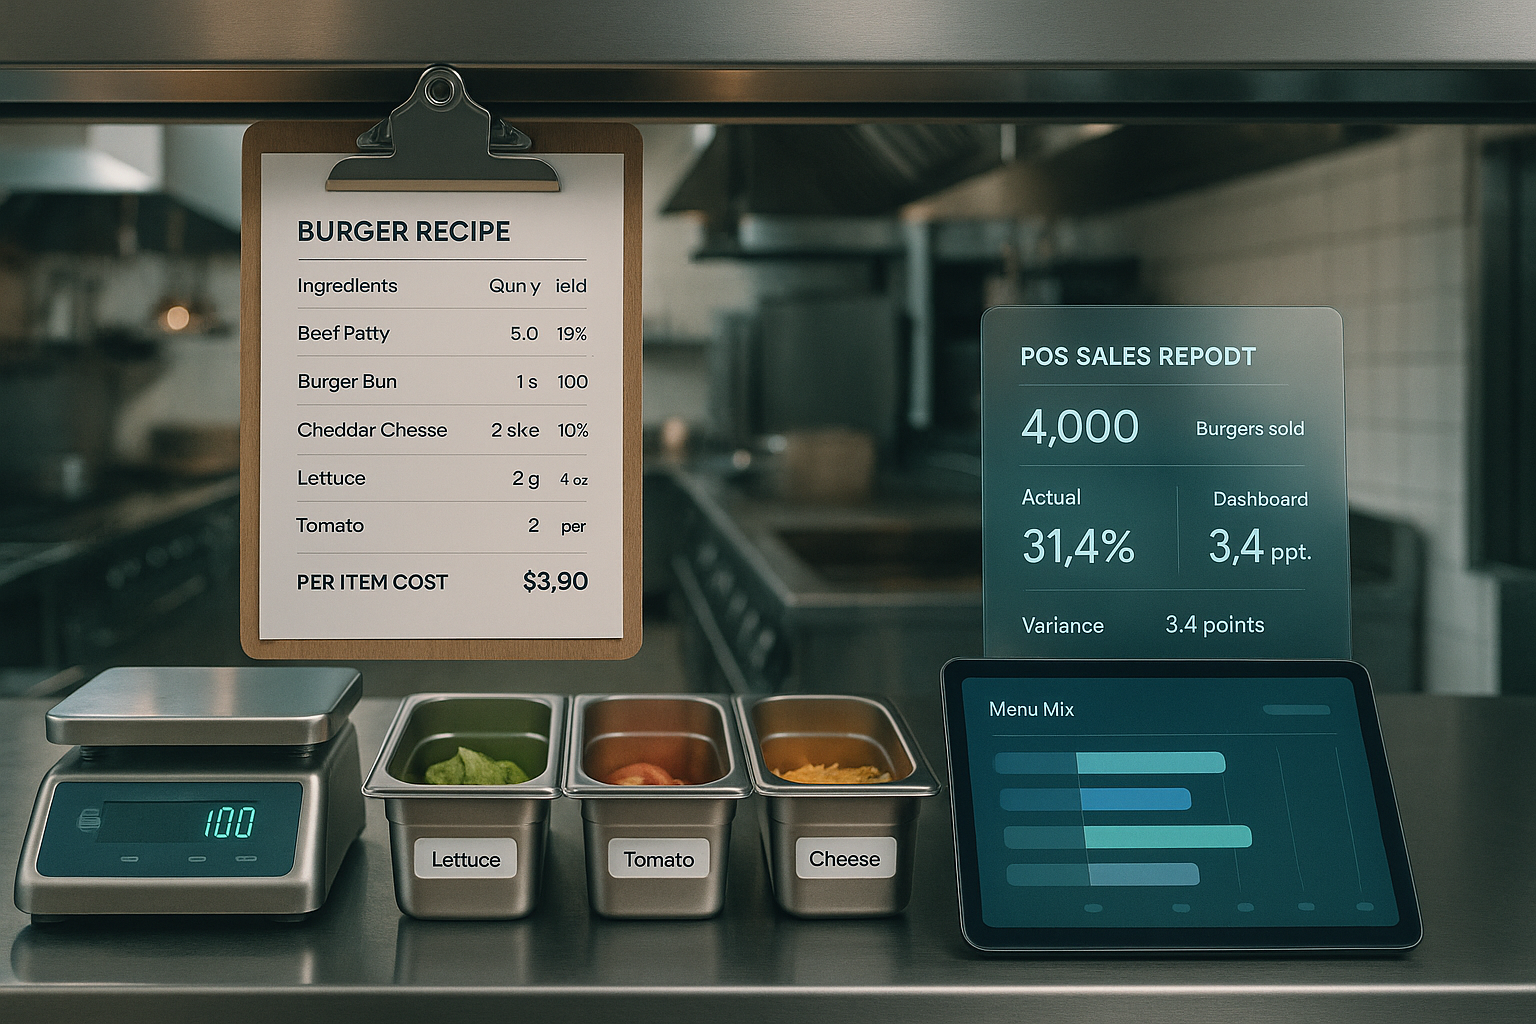
Example:
- Burger theoretical cost: $3.90
- Units sold: 4,000
- Theoretical burger usage: $15,600
Repeat that across the menu and sum the result.
If total theoretical cost for the same period is $39,200 on $140,000 in food sales:
- $39,200 ÷ $140,000 = 28.0% theoretical food cost
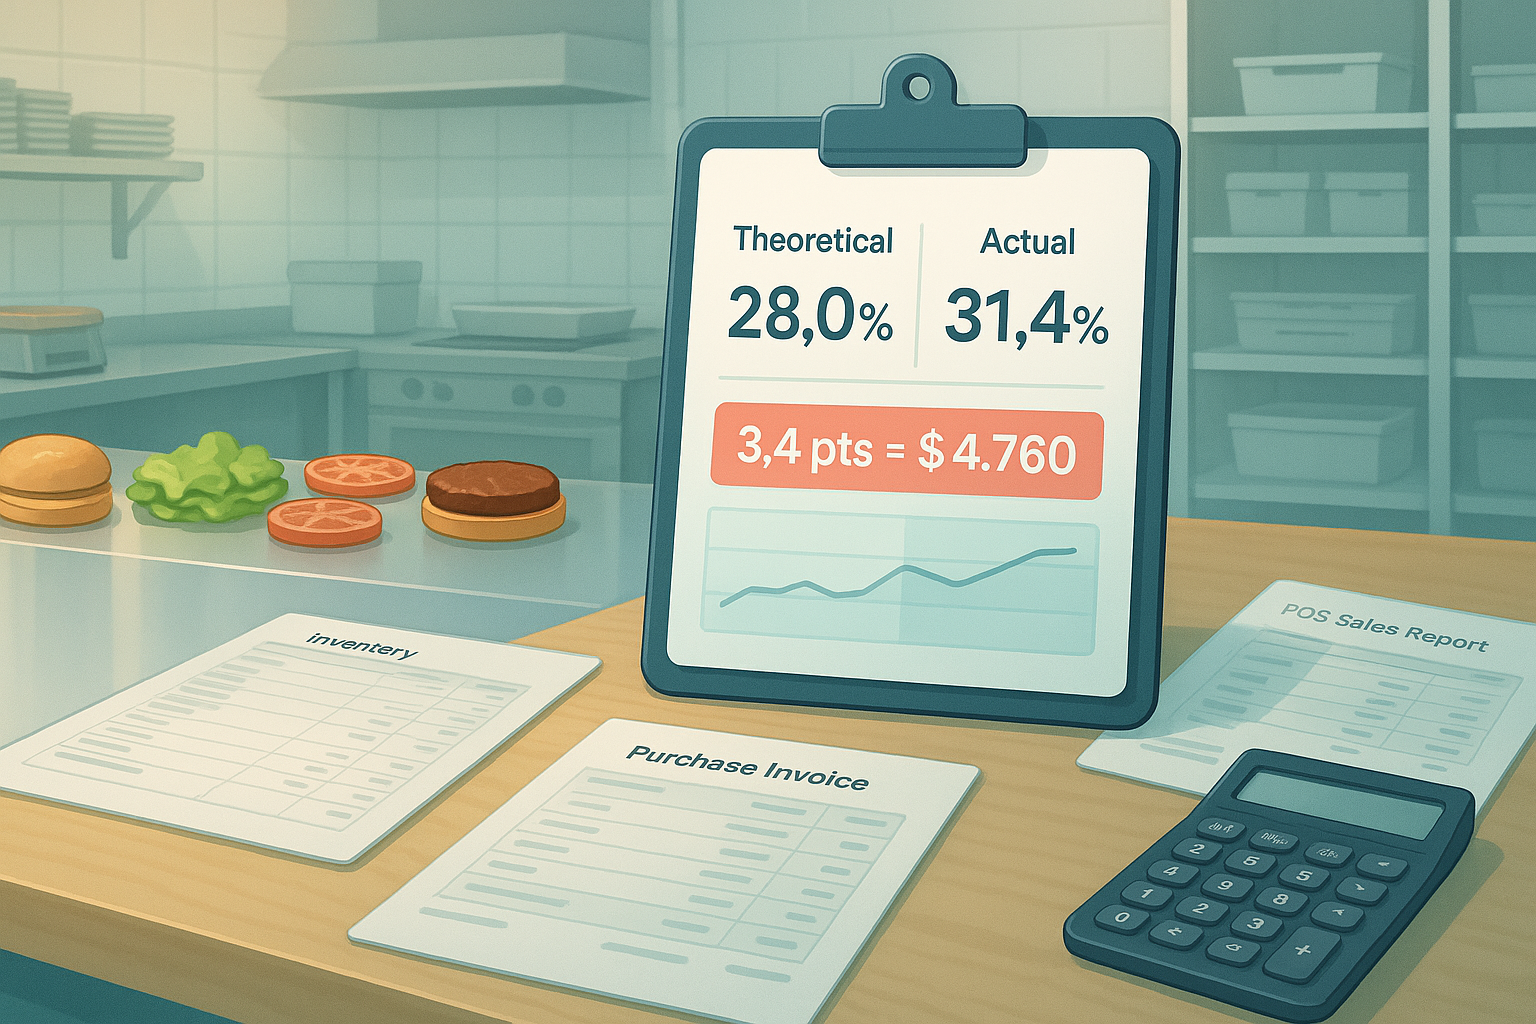
Now the variance has meaning:
- Actual: 31.4%
- Theoretical: 28.0%
- Gap: 3.4 percentage points
On $140,000 in sales, that 3.4-point gap is:
- $140,000 × 3.4% = $4,760
That is the number to chase.
Why source data breaks variance analysis
Variance becomes noisy fast when any of these fail:
Inventory counts are inconsistent
A Sunday night count done by one manager and a Monday morning count done by another can move thousands of dollars across periods. Count timing matters. Unit-of-measure discipline matters.
Recipes are outdated
If the line builds a chicken bowl with 6 ounces but the recipe still says 5 ounces, theoretical cost is understated every time the item sells.
Yield assumptions are wrong
A case of romaine never yields 100% usable product. Trim, spoilage, and prep loss need to be reflected in recipe costing.
POS items are mapped badly
If modifiers, combo components, or open food keys do not connect to recipes, theoretical usage will be incomplete. You will see “variance” that is actually a data model problem.
Invoice costs lag reality
A 14% jump in avocado cost that does not flow into item costing will distort theoretical margin. Price changes need to update quickly.
Garbage in, garbage out applies here with brutal consistency.
The formula behind food cost variance
Operators usually need two versions of the same answer: dollars and percentage points.
Food cost variance formula
The core food cost variance formula is:
Food Cost Variance % = Actual Food Cost % - Theoretical Food Cost %
Using the example above:
- 31.4% - 28.0% = 3.4 percentage points
For dollars:
Food Cost Variance $ = Actual Food Cost $ - Theoretical Food Cost $
Using the same period:
- $44,000 - $39,200 = $4,800
Small rounding differences between the percentage and dollar view are normal.
Percentage-point variance vs. dollar variance
Use percentage-point variance for:
- comparing stores with different sales volumes
- spotting trend changes week over week
- evaluating category performance across periods
- setting control thresholds
Use dollar variance for:
- quantifying profit impact
- assigning action priority
- explaining misses in a P&L review
- sizing the payoff from a fix
A 1.2-point variance may look modest until you translate it into dollars. On $300,000 in monthly food sales, 1.2 points is $3,600. Annualized, that is $43,200.
For teams searching how to calculate variance in food cost, that is the practical answer: calculate actual, calculate theoretical, then compare both in dollars and percent.
A simple food variance example
Here is a compact food variance example:
- Food sales: $100,000
- Actual food cost: $32,000
- Theoretical food cost: $29,500
Calculations:
- Actual food cost % = 32.0%
- Theoretical food cost % = 29.5%
- Variance = 2.5 percentage points
- Dollar variance = $2,500
That 2.5-point gap means the restaurant consumed $2,500 more food than the sales mix and recipe standards would predict.
Why food cost variance happens in real restaurants
Variance is rarely one issue. Most restaurants have three to five contributors at the same time.
Waste
Spoilage, overproduction, expired prep, dropped items, and remake tickets all inflate actual cost without adding sales.
Control process:
- prep-to-par by daypart
- waste logging by reason code
- shelf-life standards
- tighter 86 list discipline
A kitchen that preps 20 pounds of cut fruit for a weekday lunch and sells 12 will feel that variance by week’s end.
Over-portioning
One extra ounce of protein on a high-volume entrée adds up fast.
Example:
- 1 ounce extra chicken
- $0.42 per ounce
- 250 bowls per day
- 30 days
Impact:
- 0.42 × 250 × 30 = $3,150 per month
Control process:
- portion tools on station
- line checks
- recipe photos
- shift-level coaching
Theft and unrecorded consumption
Employee meals, unauthorized discounts, missing inventory, and unrecorded transfers all create unexplained usage.
Control process:
- employee meal policy tied to POS entries
- comp checks and void rate review
- transfer logs between locations
- variance review by high-value SKUs
Proteins, liquor-adjacent mixers, and grab-and-go items usually show problems first.
Prep yield loss
A recipe may call for 5 ounces of trimmed steak, but purchasing is done by raw weight. If the trim loss is 18% and the recipe assumes 10%, theoretical cost is understated every day.
Control process:
- yield testing by ingredient
- periodic recipe recosting
- prep sheets tied to usable yield, not case weight
Invoice price changes
Commodity movement can raise actual cost before menu pricing or recipe costing catches up.
Control process:
- invoice ingestion with current item cost updates
- exception reporting for large unit-cost swings
- menu engineering review when threshold changes hit
If fryer oil, chicken, and cheese all move in the same month, variance can widen even with solid execution.
Recipe drift
Stores often start from the same opening recipes and slowly diverge. Extra sauce. Different garnish. Unapproved substitute. Modifier handling that changed on the line but never changed in the system.
Control process:
- recipe version control
- location audit routines
- approved substitution tracking
POS-menu mapping issues
Sales data must connect to the right recipe objects. Combo meals, half portions, add-ons, promos, and open-priced keys often break this chain.
Control process:
- item-to-recipe mapping audits
- modifier cost logic
- promo validation
- category cleanup in the POS
A bad map can create “variance” on paper while the kitchen is actually executing to spec.
How to interpret variance by item, shift, and location
Headline variance is a starting point. Action starts with segmentation.
A restaurant with a 2.8-point monthly variance does not need a lecture on “controlling food cost.” It needs to know where the gap lives.
By category
Start with broad buckets:
- proteins
- produce
- dairy
- dry goods
- sauces
- bakery
If produce variance is 6 points over theoretical while proteins are stable, your issue is likely prep, yield, or spoilage. If proteins are the problem, portioning and theft move up the list.
By menu item
Item-level analysis connects variance to PMIX.
A low-variance burger line and a high-variance salad line suggest different causes. Salads may carry more yield loss, more open modifiers, and weaker prep controls. Bowls and build-your-own formats often deserve separate attention because customization increases mapping and portion risk.
By shift and daypart
Variance often clusters by time:
- late-night shifts with looser controls
- weekend brunch with more comps and remakes
- dinner rush with rushed portioning
- prep-heavy morning shifts with overproduction
Shift-level patterns turn variance into coaching. They also identify whether the issue is process design or manager execution.
By team or manager
If one store, one shift lead, or one kitchen manager consistently runs 1.5 points worse than peers on the same menu, the difference is operational.
Use this carefully. The goal is diagnosis, not blame.
Good review questions:
- Are count procedures consistent?
- Is prep built to forecast?
- Are voids and comps recorded correctly?
- Are station tools present and used?
- Is the 86 list updated in real time?
By location
Multi-unit operators need normalized variance views across stores.
Store A at 3.2 points and Store B at 1.1 points may reflect:
- different receiving discipline
- different count accuracy
- recipe drift
- local purchasing substitutions
- manager adherence to standards
Comparing only actual food cost percentage misses this. Comparing actual to theoretical by location shows which stores are truly out of control.
How Bagel helps operators turn variance into action
Variance analysis breaks down when sales, inventory, recipes, and reporting live in separate systems.
One dataset has PMIX. Another has invoice and count data. A third holds recipe standards. The operator exports spreadsheets, aligns item names, fixes unit conversions, and hopes the week is still relevant by the time the report is finished.
Bagel closes that gap by connecting the workflow:
- POS sales feed item-level demand and modifier activity
- Inventory tracks counts, purchases, transfers, and depletion
- Recipe costing sets the theoretical baseline
- Analytics show where actual and theoretical separate by item, shift, category, and store
That matters because variance only becomes useful when the cause is visible.
If actual chicken usage climbs while PMIX is flat, operators can inspect portioning, yield assumptions, or invoice changes. If variance spikes after a promo launch, they can validate modifier mapping and recipe attachment. If one location’s produce variance widens every Monday, they can look at prep cadence and weekend count accuracy.
The operational value is speed. Teams can move from month-end explanation to midweek correction.
Conclusion
Restaurant food cost variance is the gap between expected usage and actual usage. That gap is one of the clearest operating signals in the business. It ties margin loss to specific processes: purchasing, prep, portioning, waste, comps, and menu mapping.
Operators who track variance well do not stop at a single food cost percentage. They compare theoretical food cost vs actual, convert the gap into dollars, and drill into the item, shift, and location where control broke down.
If you want a cleaner view of that relationship across POS, inventory, and analytics, Bagel is opening early access for operators who want to run variance as a weekly control loop instead of a month-end surprise.
Run your restaurant on Bagel
Join the early access program and shape the operating system built for modern hospitality.
Get early access →