
June 8, 2026
How to Set Restaurant Reorder Points
Learn how to set restaurant reorder points with item-level usage, lead time, and safety stock to reduce stockouts, spoilage, and excess inventory.
A stockout on one core SKU can erase a dinner rush. An extra three days of produce on hand can push waste up 1–2 points. Reorder points sit in the middle of both problems: service risk on one side, cash and spoilage on the other.
Why reorder points matter in restaurant operations
Reorder points control timing. That timing affects four operating outcomes: stockouts, waste, working capital, and labor spent on emergency purchasing. A unit doing $2 million a year can tie up tens of thousands in excess inventory if thresholds are too high. The same unit can lose margin fast if proteins, fryer oil, packaging, or core prep items run out midweek and require comped substitutions or same-day buys.
Most operators already track pars. Fewer define a real reorder point for each item. That gap matters because par answers “how much should I have after I order,” while reorder point answers “when do I need to place the next order.” Those are different controls. One manages target inventory. The other manages timing under lead time, demand variability, and shelf life.
This is why how to set restaurant reorder points is an operating control question, not a spreadsheet exercise. A usable threshold has to match how the kitchen actually depletes product, how vendors actually deliver, and how often your team actually counts.
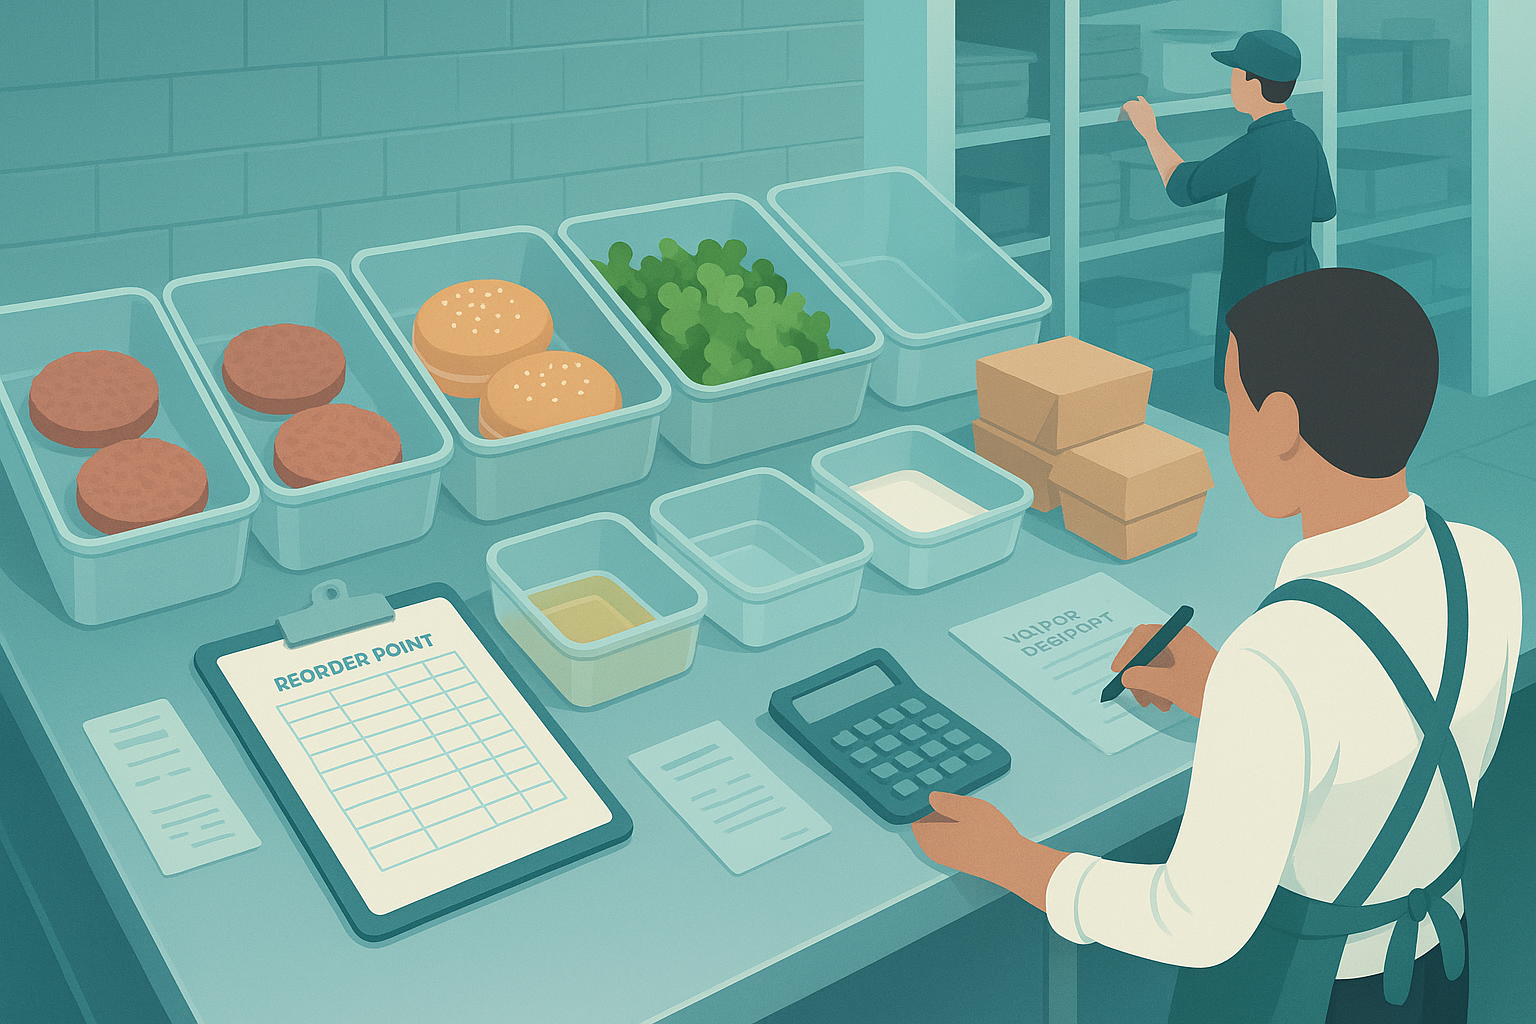
What you need before you calculate anything
 A practical reorder point combines actual usage, vendor lead time, and a safety buffer the team can count against.
Start with six inputs. Keep them item-level.
- Recent usage history. Use actual depletion if possible, not just theoretical menu sales. Transfers, waste, over-portioning, and prep loss all matter.
- Vendor lead times. Measure the real delay from submitted PO to product on shelf. Use actual receiving history, not the stated schedule.
- Order cadence. Note which days you place orders and which days each vendor delivers. A twice-weekly produce order works differently from a six-day distributor route.
- Shelf-life constraints. Leafy greens, seafood, dairy, sauces, frozen goods, and dry goods each need different buffers.
- Current par assumptions. Existing pars show how the team thinks about stock coverage. They often contain useful context even when the number is wrong.
- People and process. Purchasing, kitchen leads, and inventory counters all affect count accuracy and order timing.
Without those inputs, the restaurant reorder point formula becomes abstract. With them, it becomes operational. You are building a count threshold the team can act on during inventory review, not solving for textbook precision.
Step 1: Group items by risk and ordering pattern
 Grouping SKUs by demand pattern, lead time, and perishability makes reorder points more accurate.
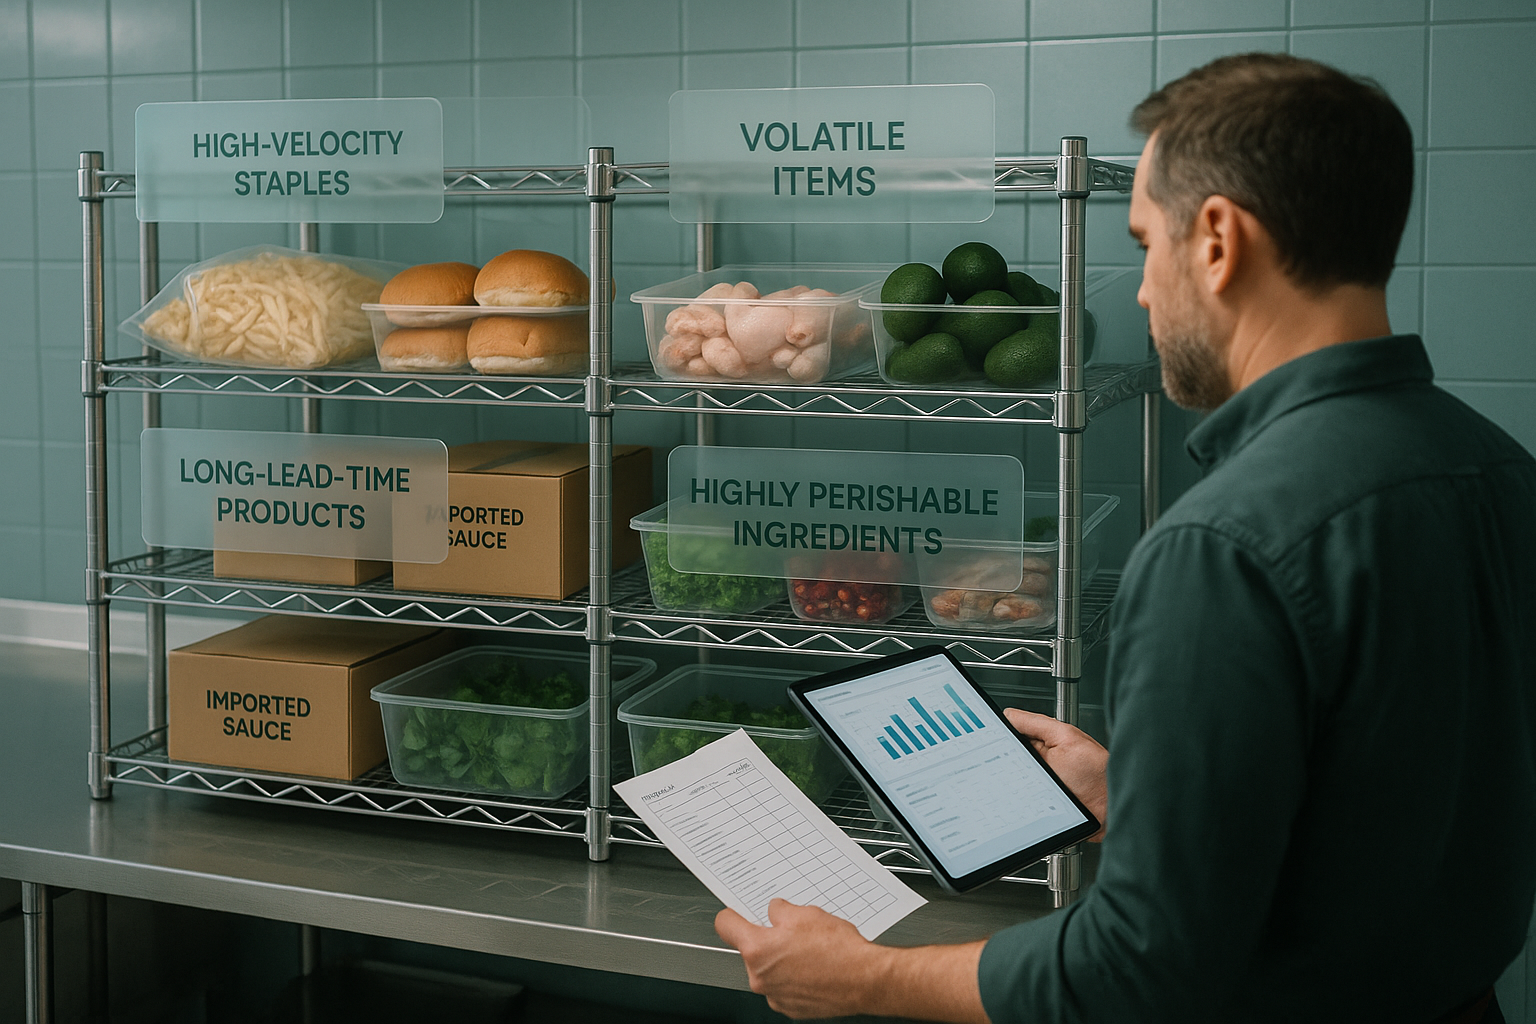
A blanket rule across all SKUs creates bad thresholds. Split items into operating groups first.
High-velocity staples
These are products with steady depletion and direct service impact: burger patties, fries, buns, chicken, rice, tortillas, fryer oil, cups, lids. Usage is usually predictable. Stockout cost is high. Reorder points can be tighter because the signal is clear and counts happen often.
Volatile items
These move with promotions, weather, local events, third-party channel mix, or daypart spikes. Think avocado, wings during sports nights, seasonal beverages, limited-time ingredients. These need wider safety stock because average usage hides large swings.
Long-lead-time products
Some proteins, specialty imports, branded packaging, or commissary-produced items have inconsistent or extended lead times. Service risk rises fast when lead time stretches from two days to five. These items need lead-time protection more than demand protection.
Highly perishable ingredients
Berries, herbs, cut greens, fresh seafood, fresh bakery, and short-life dairy can spoil before the next count. Safety stock has to stay conservative. A perfect fill rate is less valuable if spoilage wipes out margin.
This grouping changes how you set restaurant inventory management reorder points. High-velocity staples may support a stricter formula. Perishables need operator judgment layered on top. Long-lead items need lead-time tracking every week.
Step 2: Calculate average usage and realistic lead time
Now build the baseline for each item: expected usage during replenishment delay.
Use depletion, not just sales mix
If you only use PMIX or theoretical menu usage, you miss waste, variance, comps, training errors, and prep yield loss. Pull recent depletion from inventory movement if available. If not, use beginning inventory + purchases - ending inventory over a defined period.
A simple method:
- Choose a recent window: 4 to 8 weeks for stable items, 2 to 4 weeks for volatile items.
- Exclude obvious anomalies: closure days, major catering one-offs, menu tests.
- Divide total depletion by days open to get average daily usage.
Example: a fast-casual unit used 420 pounds of chicken over 28 open days. Average daily usage is 15 pounds.
Use actual lead time, not quoted lead time
Lead time should reflect what the restaurant experiences. If a vendor says “next day” but half the orders arrive in two days, your restaurant inventory lead time is not one day. Track the real interval between PO submission and received product.
For each item or vendor category, note:
- Average lead time
- Longest lead time in recent history
- Delivery-day constraints
- Order cutoff times
Example: produce ordered Monday by 3 p.m. usually arrives Wednesday morning. That is effectively a 2-day lead time. If missed cutoffs push delivery to Thursday, the operational lead time can become 3 days.
Baseline demand during lead time is:
Average daily usage × lead time in days
For the chicken example above, with a 2-day lead time:
15 pounds × 2 = 30 pounds
That gets you only to expected demand. It does not yet protect service.
Step 3: Add safety stock for demand swings and delivery uncertainty
Safety stock covers the gap between average conditions and actual operations. This is where most reorder points fail. Teams either skip the buffer entirely or overcorrect and hold excess inventory.
Build the buffer from observed risk
Use recent operating evidence:
- Sales spikes by daypart or weekday
- Promotions and local events
- Delivery inconsistency
- Count accuracy issues
- Prep yield variation
- Transfer delays between stores
- Shelf-life limits
A practical safety stock restaurant inventory method is to estimate extra days of coverage based on risk tier.
- Stable staple: 0.5 to 1 extra day
- Volatile item: 1 to 2 extra days
- Long-lead or inconsistent vendor item: 1 to 3 extra days
- Short-shelf-life perishable: 0 to 0.5 extra day, sometimes none
Then convert that coverage into units.
Example: chicken averages 15 pounds per day. Demand is fairly stable, but deliveries miss the window about once every two weeks. Add 1 day of safety stock.
Safety stock = 15 pounds
If avocados average 24 units per day but swing hard on weekends and spoil quickly, you may carry only 0.5 day of safety stock:
Safety stock = 12 units
This is less precise than a standard deviation model, but more usable for most restaurant teams. If you want a stricter reorder level formula, you can use variability by item later. Start with a buffer the team can maintain.
Step 4: Set the reorder point for each item
Now combine baseline demand and safety stock.
Reorder point = expected usage during lead time + safety stock
That is the core restaurant reorder point formula. Translate it into the count threshold your team will use.
Using the chicken example:
- Average daily usage: 15 pounds
- Lead time: 2 days
- Safety stock: 15 pounds
Reorder point = (15 × 2) + 15 = 45 pounds
If on-hand chicken falls to 45 pounds or lower during count review, reorder.
Using avocados:
- Average daily usage: 24 units
- Lead time: 2 days
- Safety stock: 12 units
Reorder point = (24 × 2) + 12 = 60 units
This answers how to calculate reorder point for restaurant inventory in a way the kitchen can use. The number is not theoretical. It is the count line that triggers purchasing.
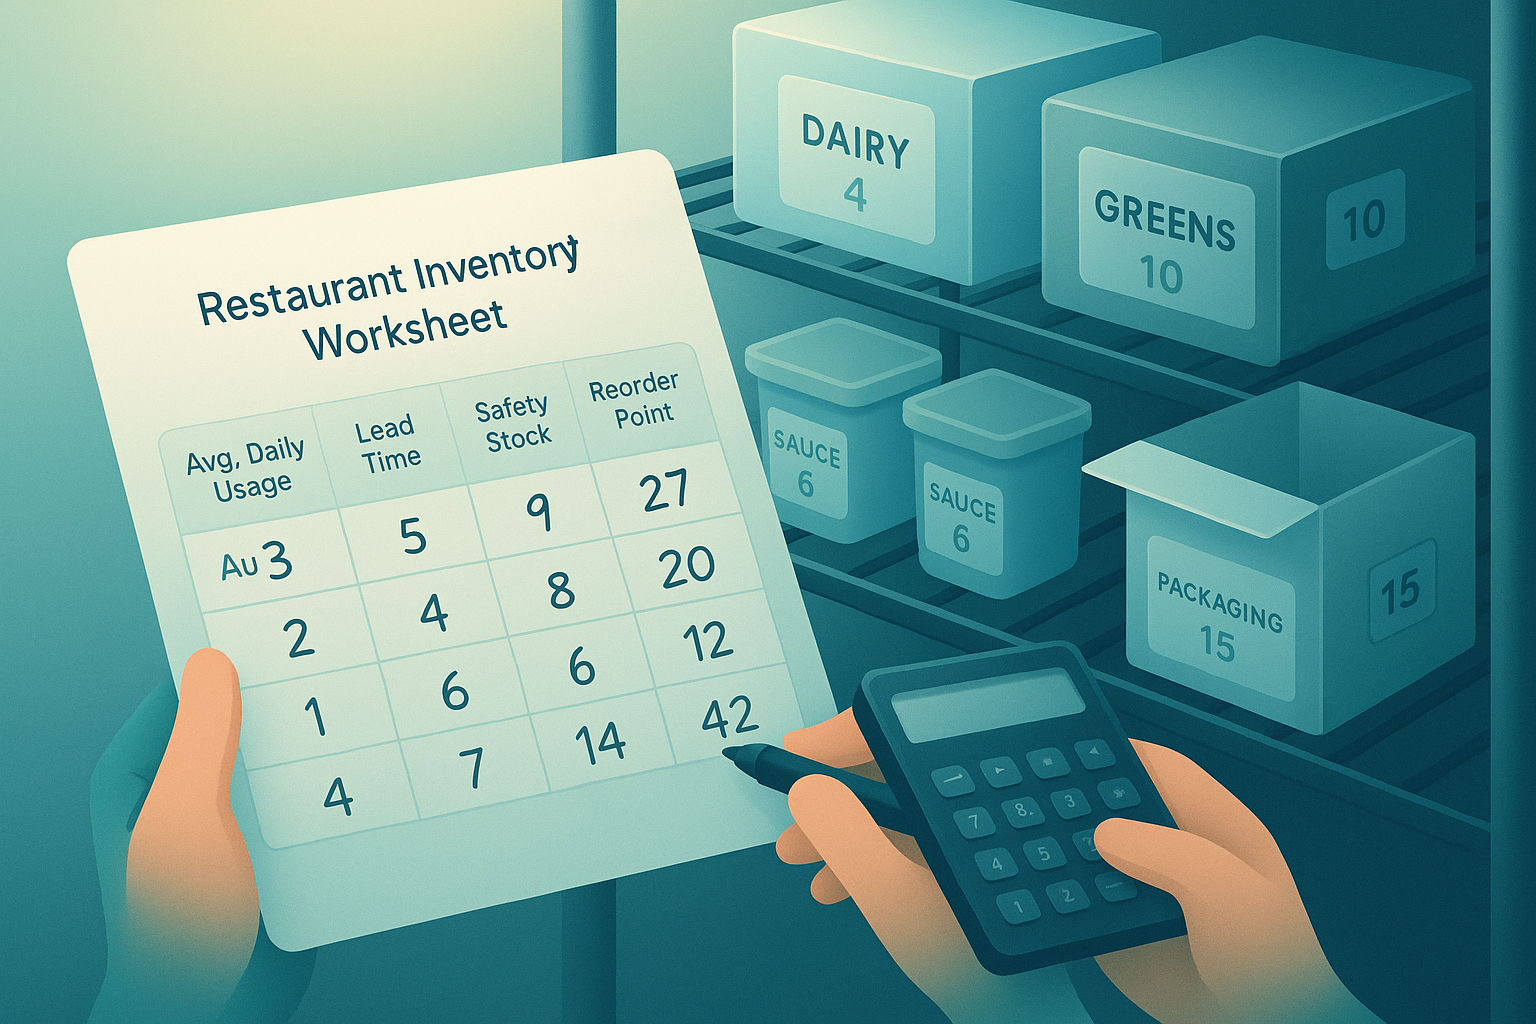
A simple worksheet or reorder point calculator should show at least these fields:
| Item | Avg daily usage | Lead time | Safety stock | Reorder point | Current on hand |
|---|---|---|---|---|---|
| Chicken breast | 15 lb | 2 days | 15 lb | 45 lb | 52 lb |
| Avocado | 24 ea | 2 days | 12 ea | 60 ea | 48 ea |
| Fries | 40 lb | 3 days | 20 lb | 140 lb | 180 lb |
Once current on-hand drops below the reorder point, place the order. Order quantity is a separate decision tied to par, order cycle, and storage.
Step 5: Align reorder points with pars, order days, and prep reality
This is where restaurant operations diverge from standard warehouse logic. The threshold has to fit receiving schedules, prep cycles, and physical space.
Par level and reorder point are different
Par is your target inventory position after ordering or receiving. Reorder point is the trigger to place the order. If a store orders produce on Monday and Thursday, the reorder point may fire before the item reaches par because the next ordering opportunity is fixed.
Example:
- Reorder point for romaine: 18 heads
- Order day: Monday and Thursday
- Target par after Thursday delivery: 42 heads
If Thursday count is 16 heads, you order enough to get back to 42, adjusted for expected usage before delivery. The reorder point triggered the order. Par determined quantity.
Prep cycles matter
Some ingredients turn into prep before service. Raw cases of tomatoes become diced line-ready inserts. Chicken becomes marinated batches. Dough becomes proofed trays. Count thresholds should reflect the form the team actually relies on during service.
Include prep conversion in your logic:
- 1 case raw product may yield 18 service-ready portions
- Prep labor may only happen once per day
- A missed prep window creates a service stockout before raw inventory hits zero
For these items, the practical threshold may be based on both raw stock and prepared stock.
Storage can cap your threshold
Walk-ins, freezers, and dry storage impose hard limits. A mathematically sound reorder point that requires holding six extra cases is still wrong if the store has no space or if airflow and food safety degrade. Final thresholds should fit actual capacity by station and storage zone.
Step 6: Review exceptions and adjust weekly
Reorder points drift. Menu mix changes. A new promo shifts demand. A supplier misses routes for three weeks. Thresholds need review.
Audit four exception types every week:
- Stockouts and 86s. Which items ran short, on what day, and at what on-hand count?
- Spoilage. Which items repeatedly exceed usable demand?
- Emergency purchases. Which SKUs require off-cycle runs or distributor substitutions?
- Count errors. Which items show recurring variances between theoretical and actual?
Adjust one variable at a time. If stockouts cluster around delivery delays, raise safety stock or revise lead time. If waste rises on short-life items, reduce safety stock or tighten order cadence. If counts are unreliable, fix counting process before changing the number again.
A reorder point is not permanent. It is a maintained operating threshold.
Common mistakes operators make
Confusing par with reorder point is the most common error. The result is ordering too late or carrying too much. Ignoring lead-time variability is next. Average supplier timing looks fine until a holiday week or missed cutoff creates a service gap.
Using theoretical sales instead of actual depletion also distorts the threshold. Products disappear through trim loss, over-portioning, spills, and staff meals. One rule across all SKUs causes equal damage. Fries, herbs, and custom packaging do not belong under the same reorder logic.
Many teams also fail to revisit thresholds after menu, volume, or channel changes. A unit that adds catering, late-night, or a new delivery mix can change usage patterns within days. Reorder points set six months ago may already be wrong.
How Bagel helps
Bagel connects sales, inventory movement, prep, and purchasing in one system, so reorder points
Run your restaurant on Bagel
Join the early access program and shape the operating system built for modern hospitality.
Get early access →